zookeeper集群 1,5161,516
5/21/2020
5/21/2020
1
>=6.2.5
Prometheus
Description
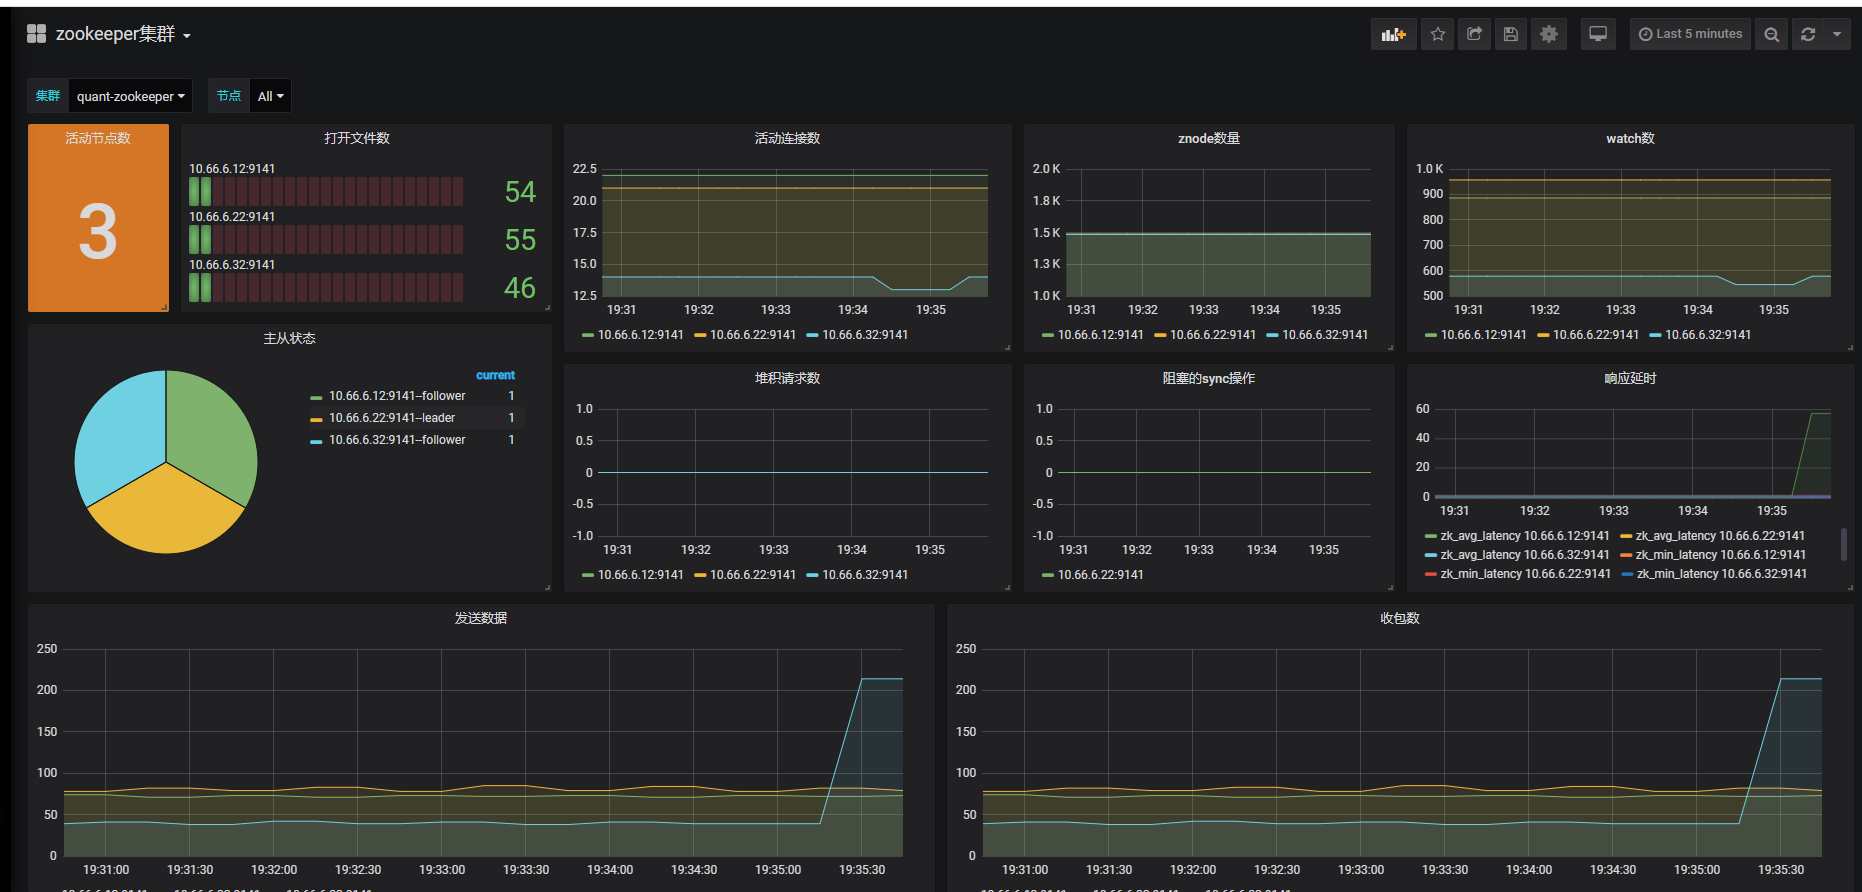
基于zookeeper_exporter创建的多数据中心,多集群dashboard,数据源为prometheus
Screenshots
Used Metrics 1313
zk_avg_latency
zk_max_latency
zk_min_latency
zk_num_alive_connections
zk_open_file_descriptor_count
zk_outstanding_requests
zk_packets_received
zk_packets_sent
zk_pending_syncs
zk_server_state
zk_up
zk_watch_count
zk_znode_count
Get Dashboard✕
Download
Copy to Clipboard