Zipkin / Prometheus 283,850283,850
Description
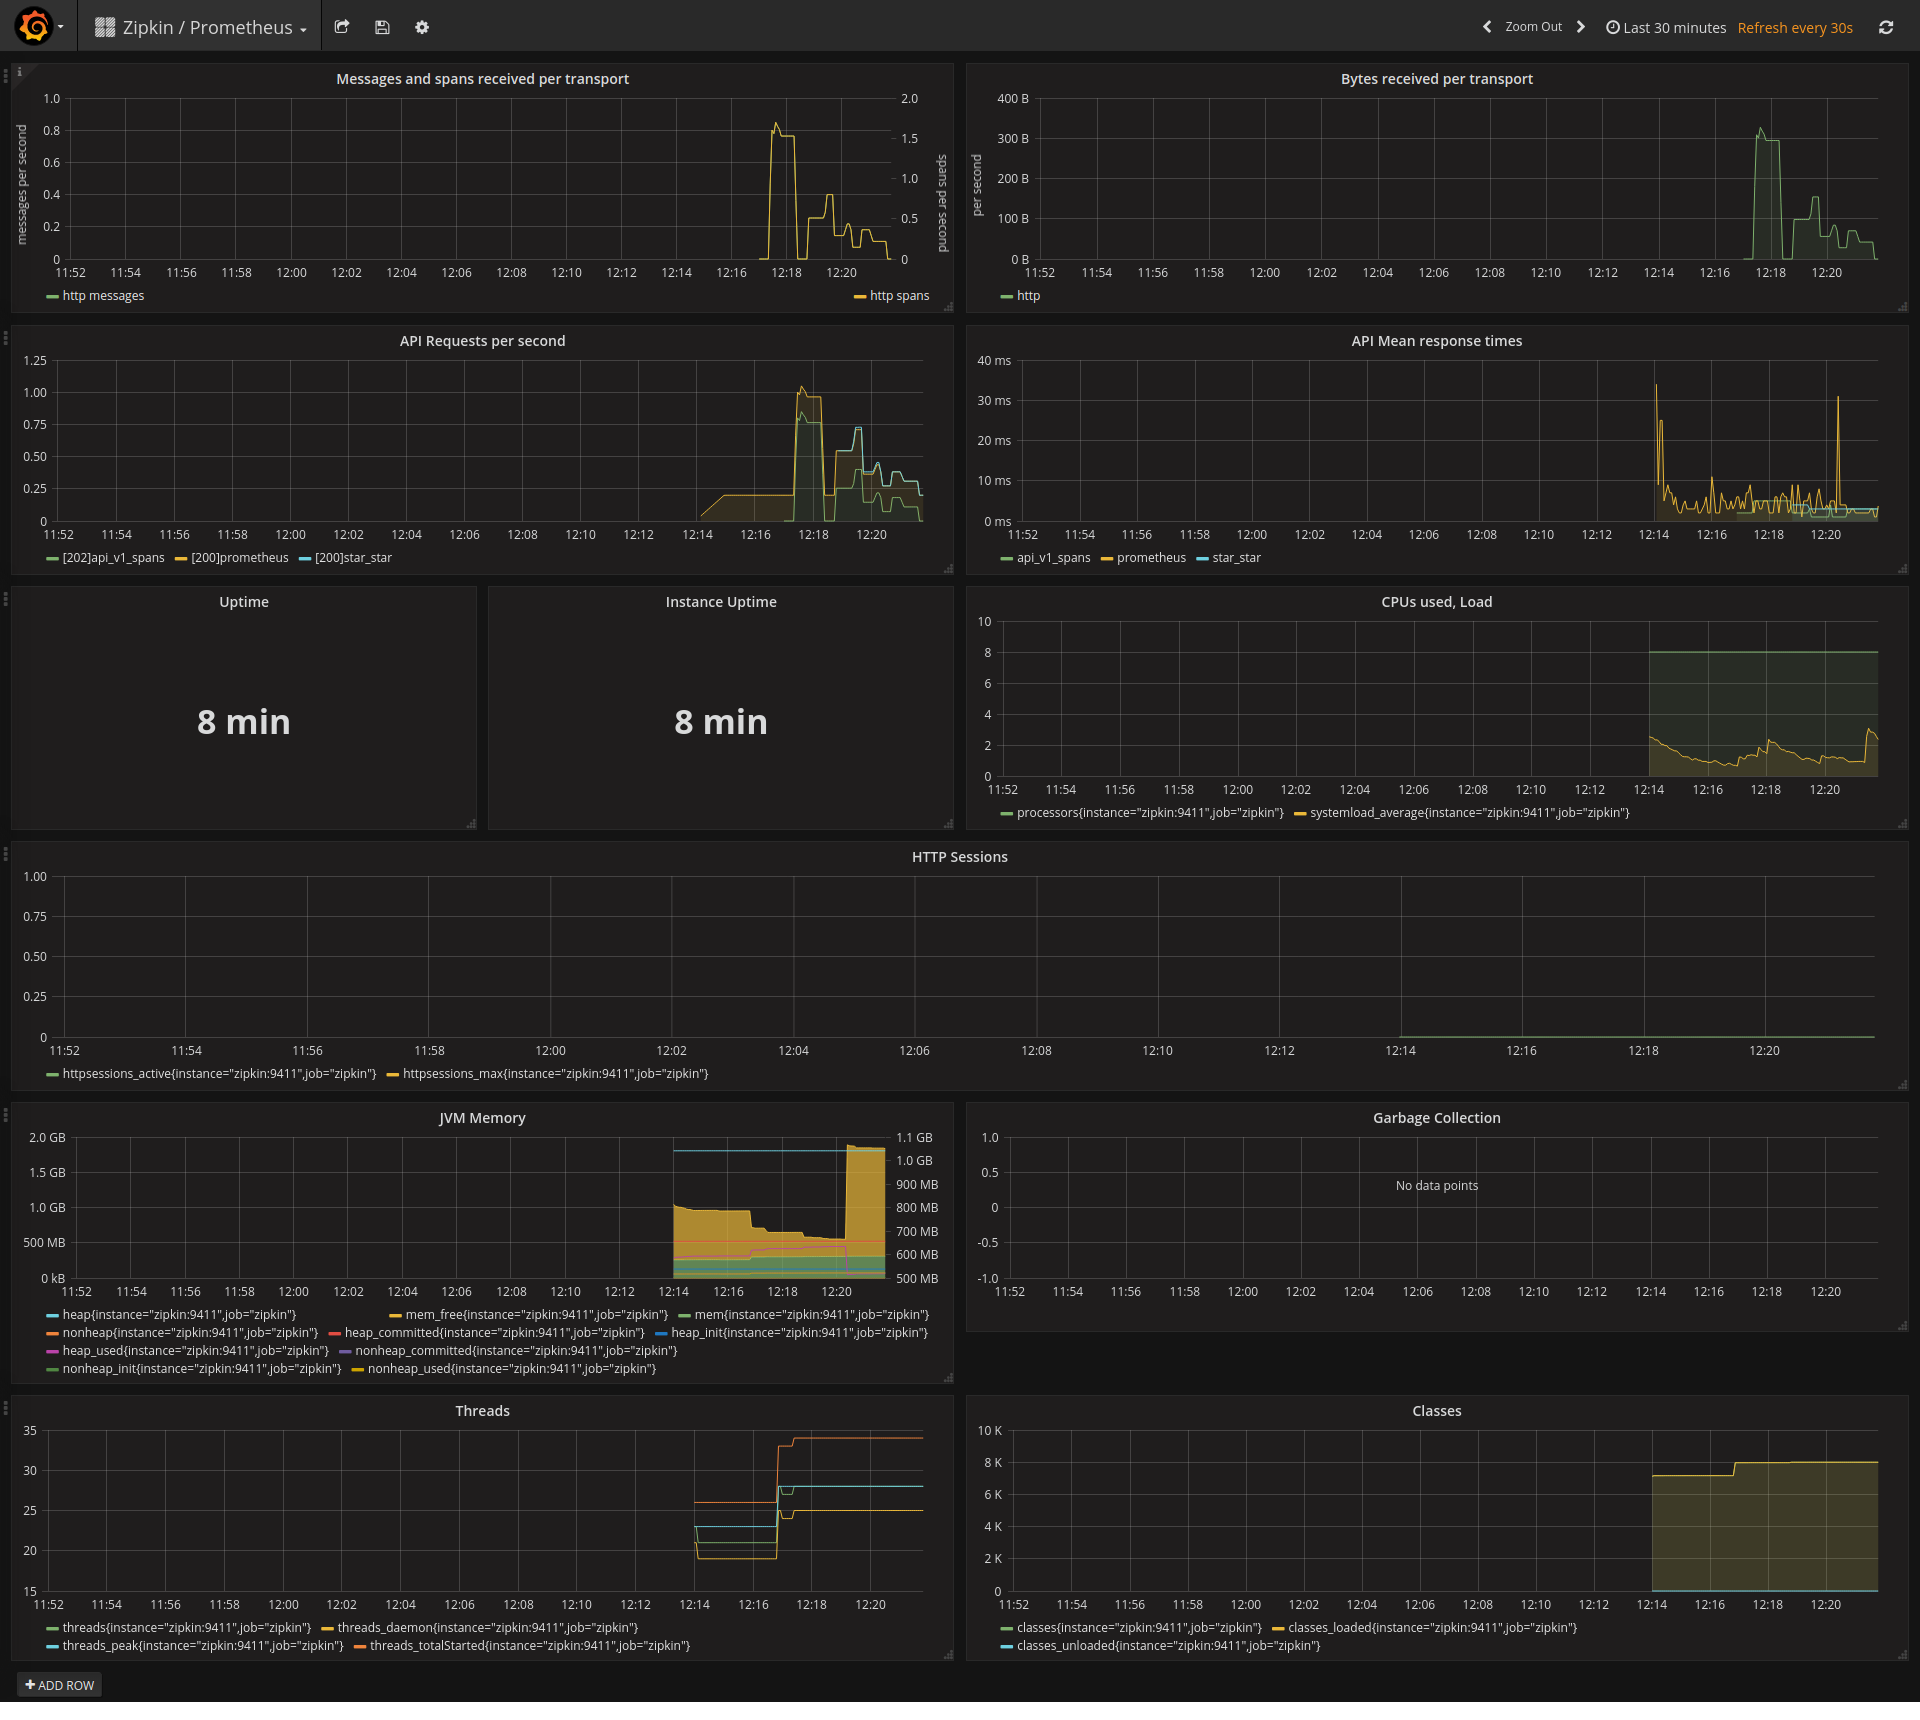
This dashboard monitors the health and throughput of a Zipkin/Prometheus tracing stack, tracking both inbound log/trace flow and backend handling metrics. It highlights per-second message and span rates (e.g., log4j2_events_total, zipkin_collector_messages_total, zipkin_collector_spans_total), reliability with dropped counts (zipkin_collector_messages_dropped_total, zipkin_collector_spans_dropped_total), and resource utilization (e.g., system_load_average, system_cpu_count, JVM Memory). Key features include granular transport-level metrics (e.g., Bytes received per transport, Requests per second), and JVM and GC insights to diagnose performance bottlenecks.
Screenshots
Used Metrics 2121
http_server_requests_seconds_bucket
http_server_requests_seconds_count
jvm_buffer_total_capacity_bytes
jvm_classes_loaded_classes
jvm_classes_unloaded_classes_total
jvm_gc_pause_seconds_count
jvm_gc_pause_seconds_sum
jvm_memory_max_bytes
jvm_memory_used_bytes
jvm_threads_daemon_threads
jvm_threads_live_threads
jvm_threads_peak_threads
jvm_threads_states_threads
log4j2_events_total
system_cpu_count
system_load_average_
zipkin_collector_bytes_total
zipkin_collector_messages_dropped_total
zipkin_collector_messages_total
zipkin_collector_spans_dropped_total
zipkin_collector_spans_total