YugabyteDB (deprecated) 206,787206,787
7/10/2020
2/14/2025
2
Databases
>=7.0.3
Prometheus
Description
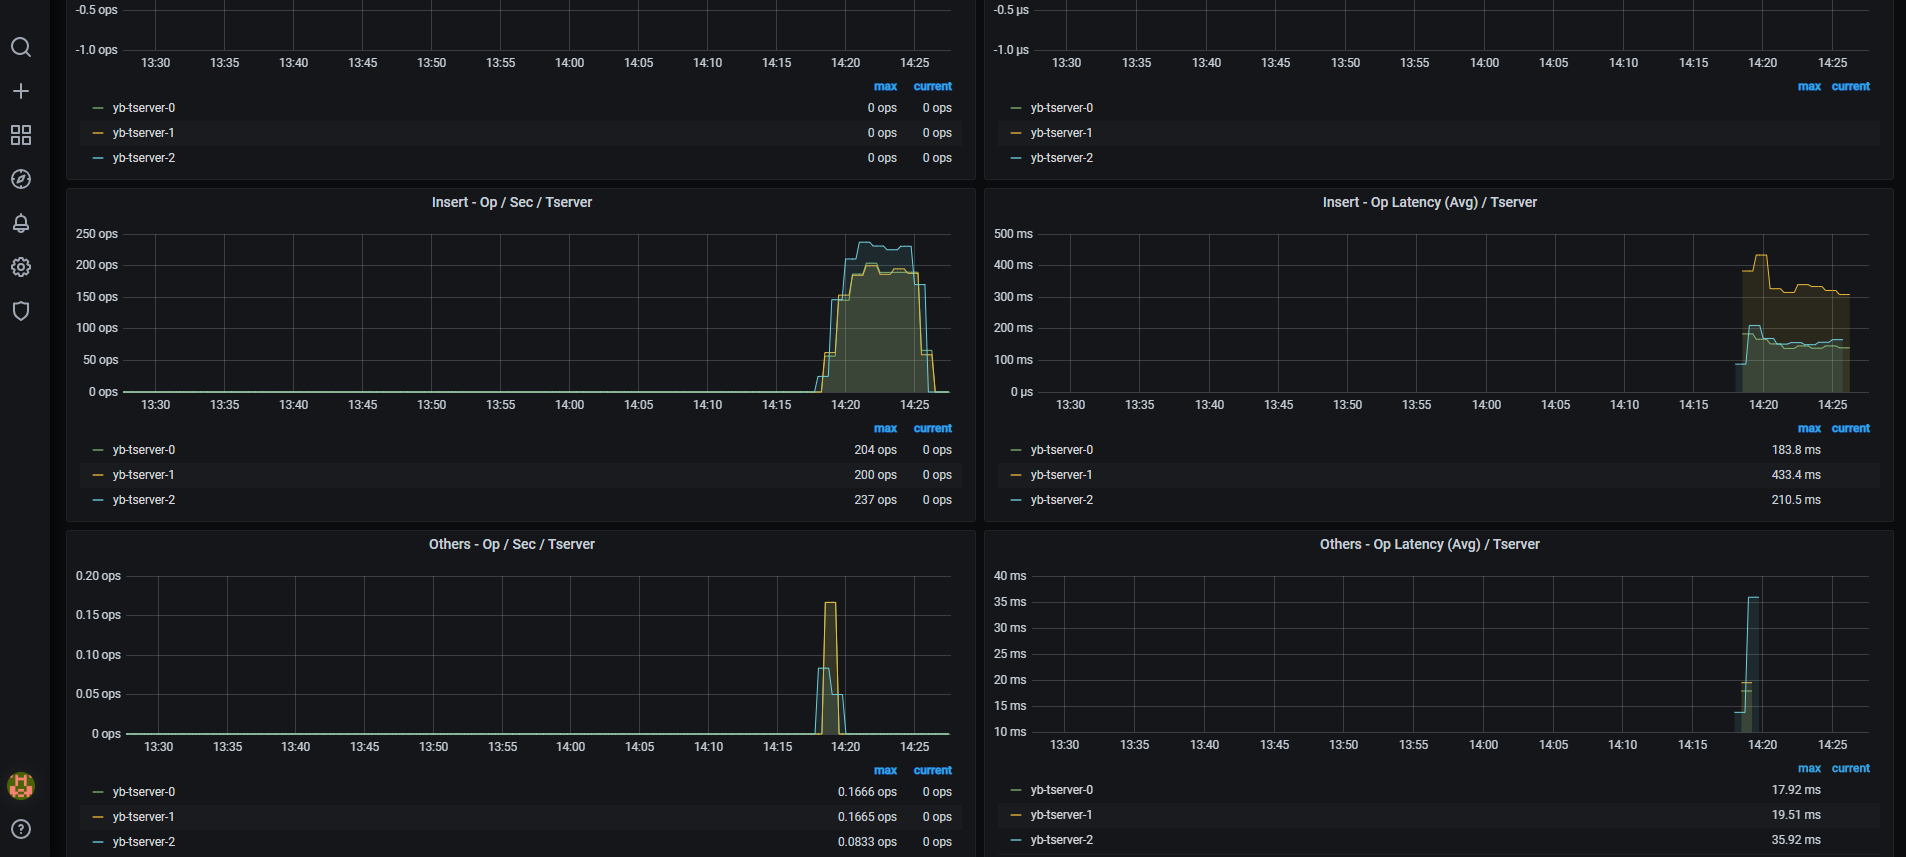
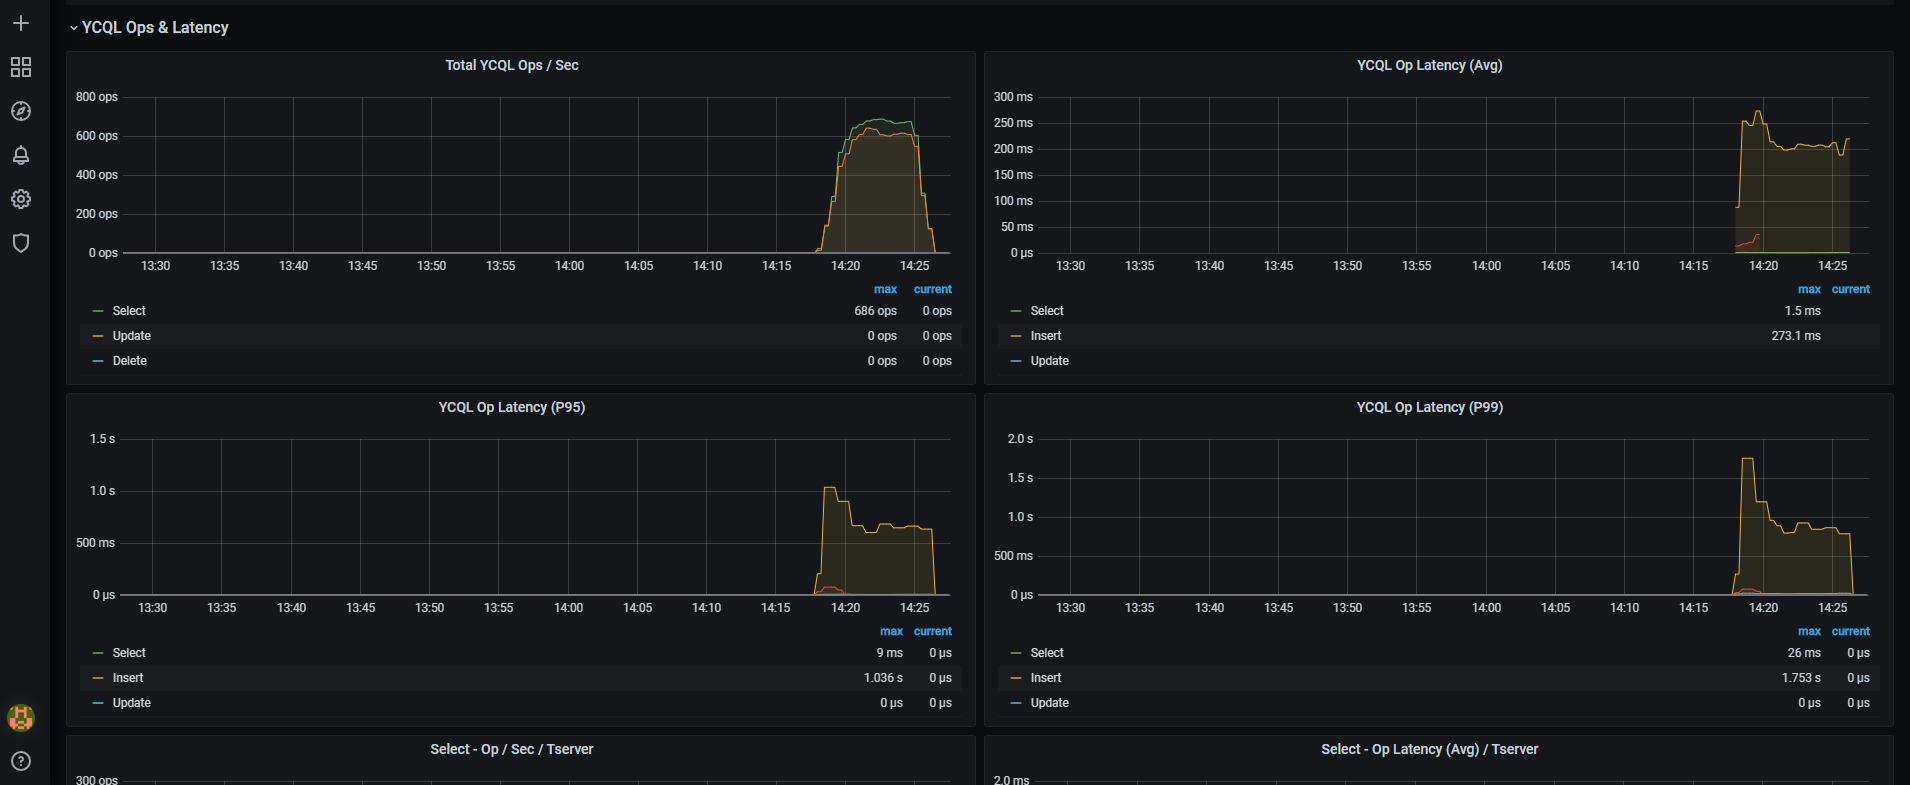
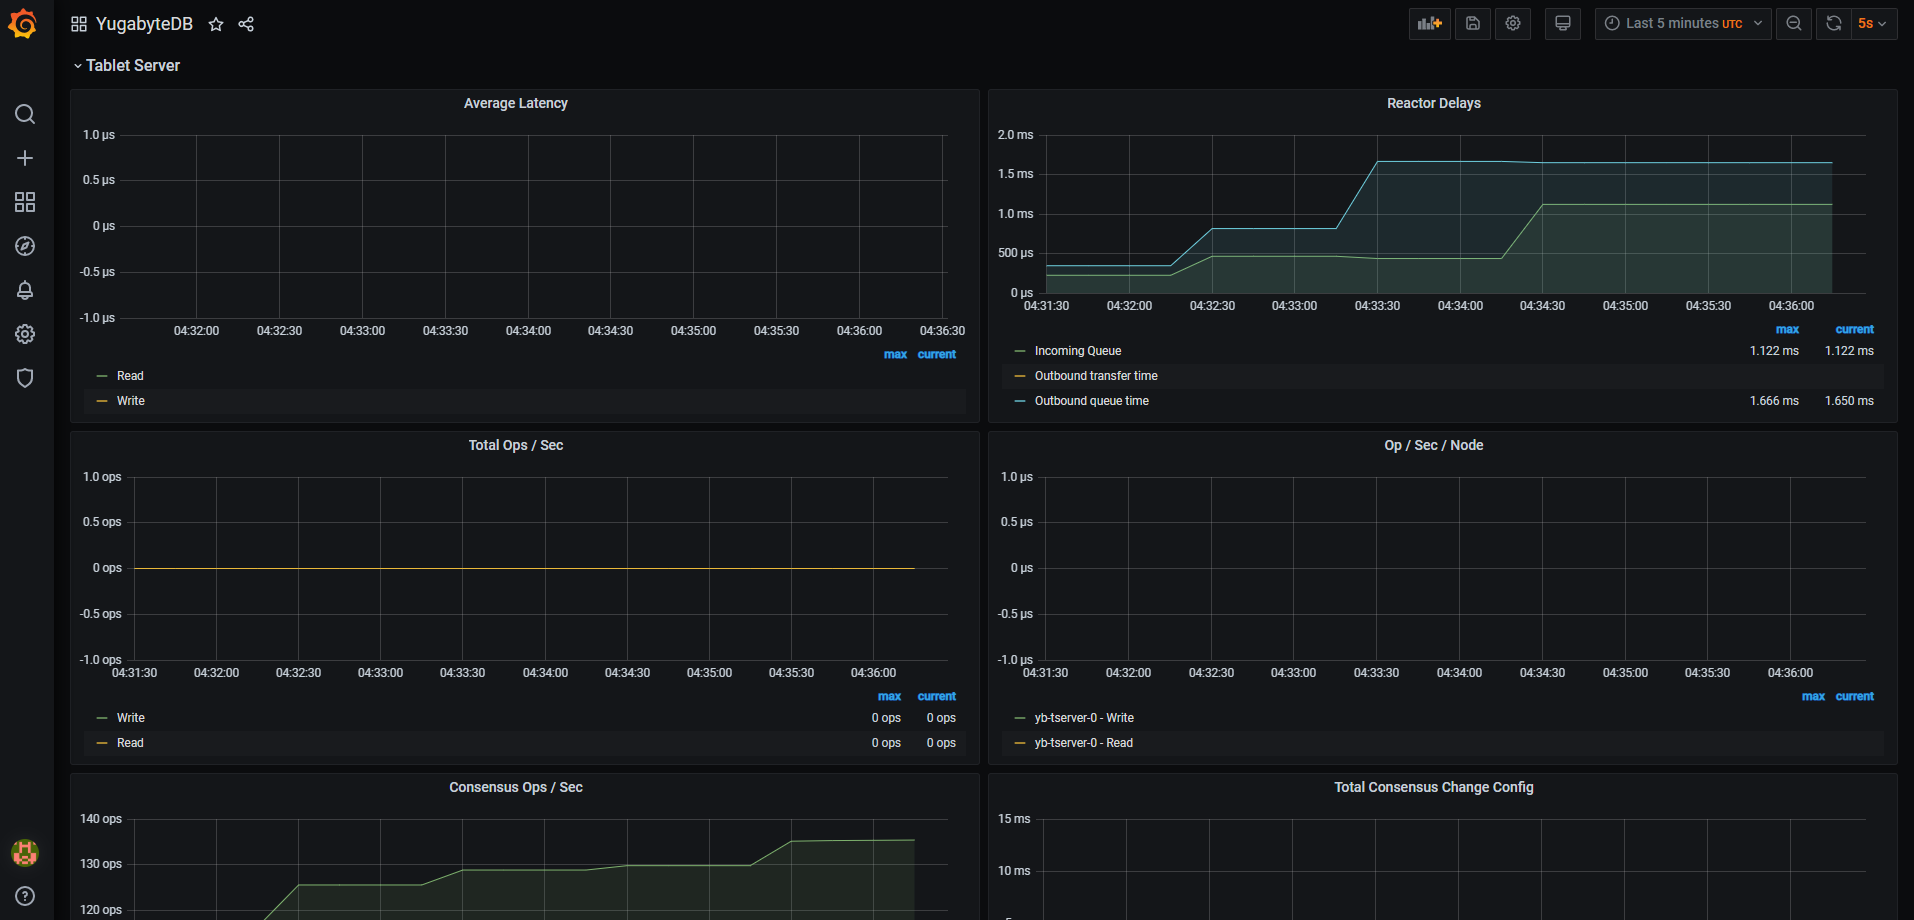
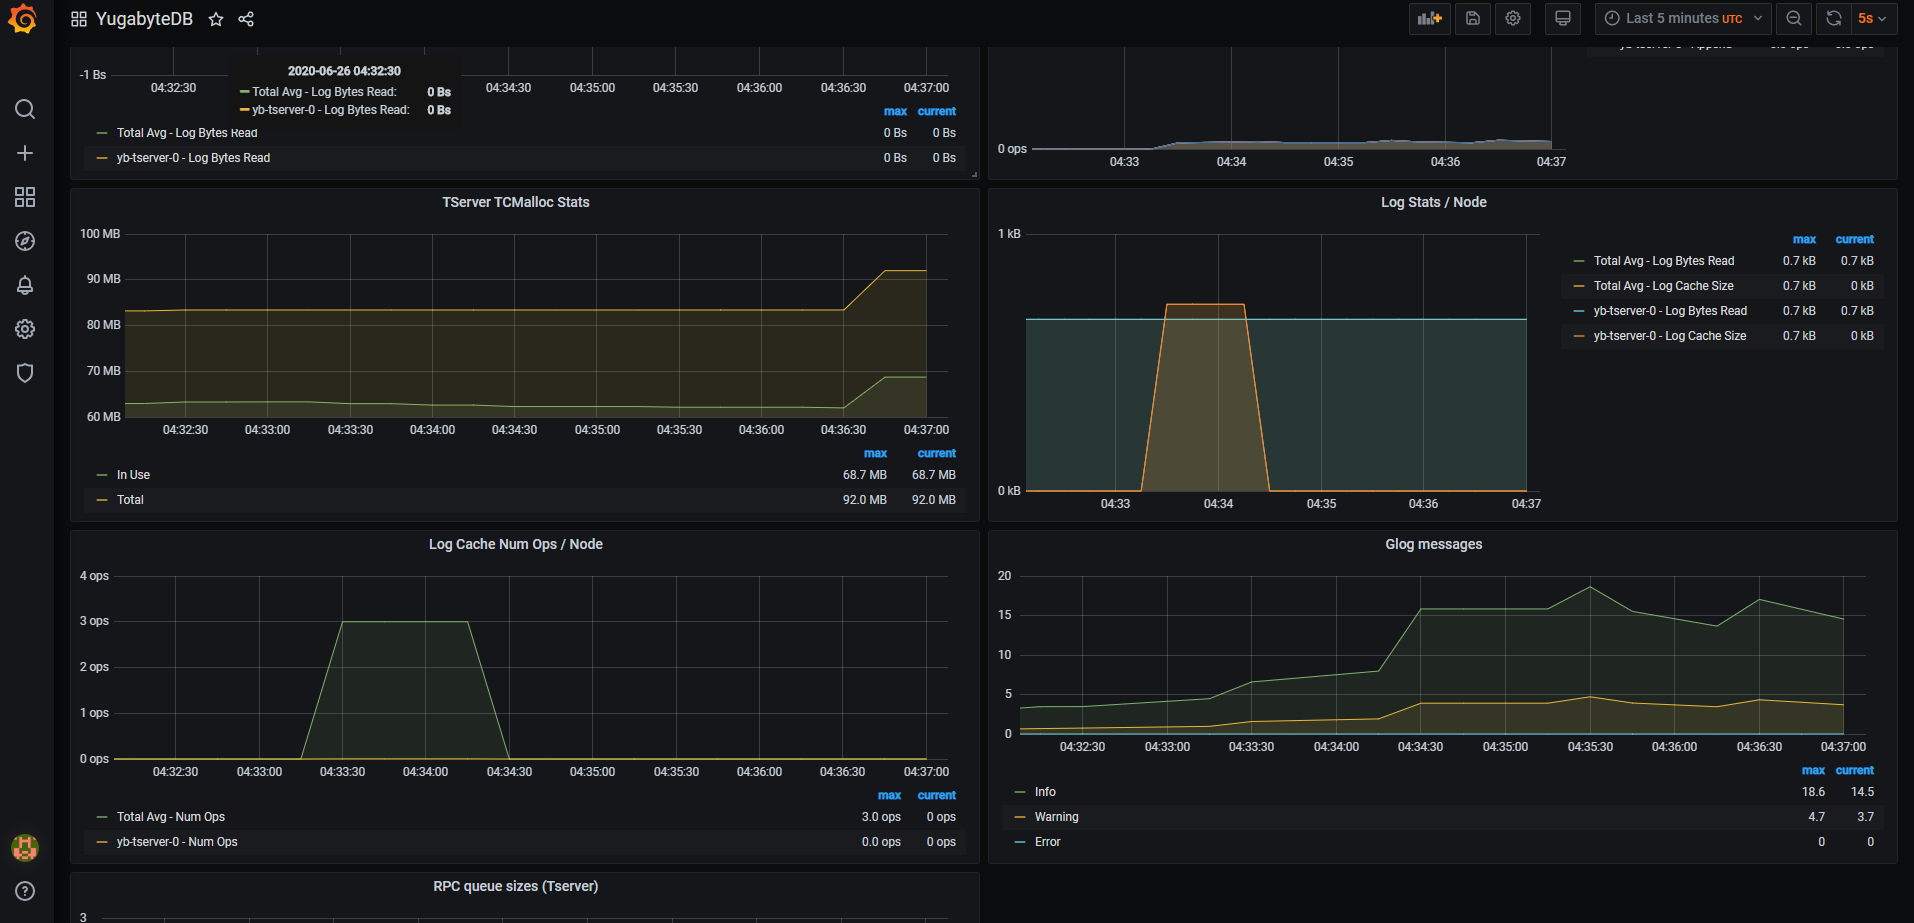
This dashboard monitors the health and status of YugabyteDB nodes by visualizing per-node service availability and role-specific state. It highlights node-level availability with metrics like up7000 and up9000, and provides role-focused panels such as Master Status - $node and Tserver Status - $node to quickly assess master and tablet server readiness across the cluster.
Screenshots
Used Metrics 22
up7000
up9000
Get Dashboard✕
Download
Copy to Clipboard