Yet Another Prometheus NUT Exporter 2,3022,302
12/16/2021
10/16/2022
2
>=9.2.0
Prometheus
Description
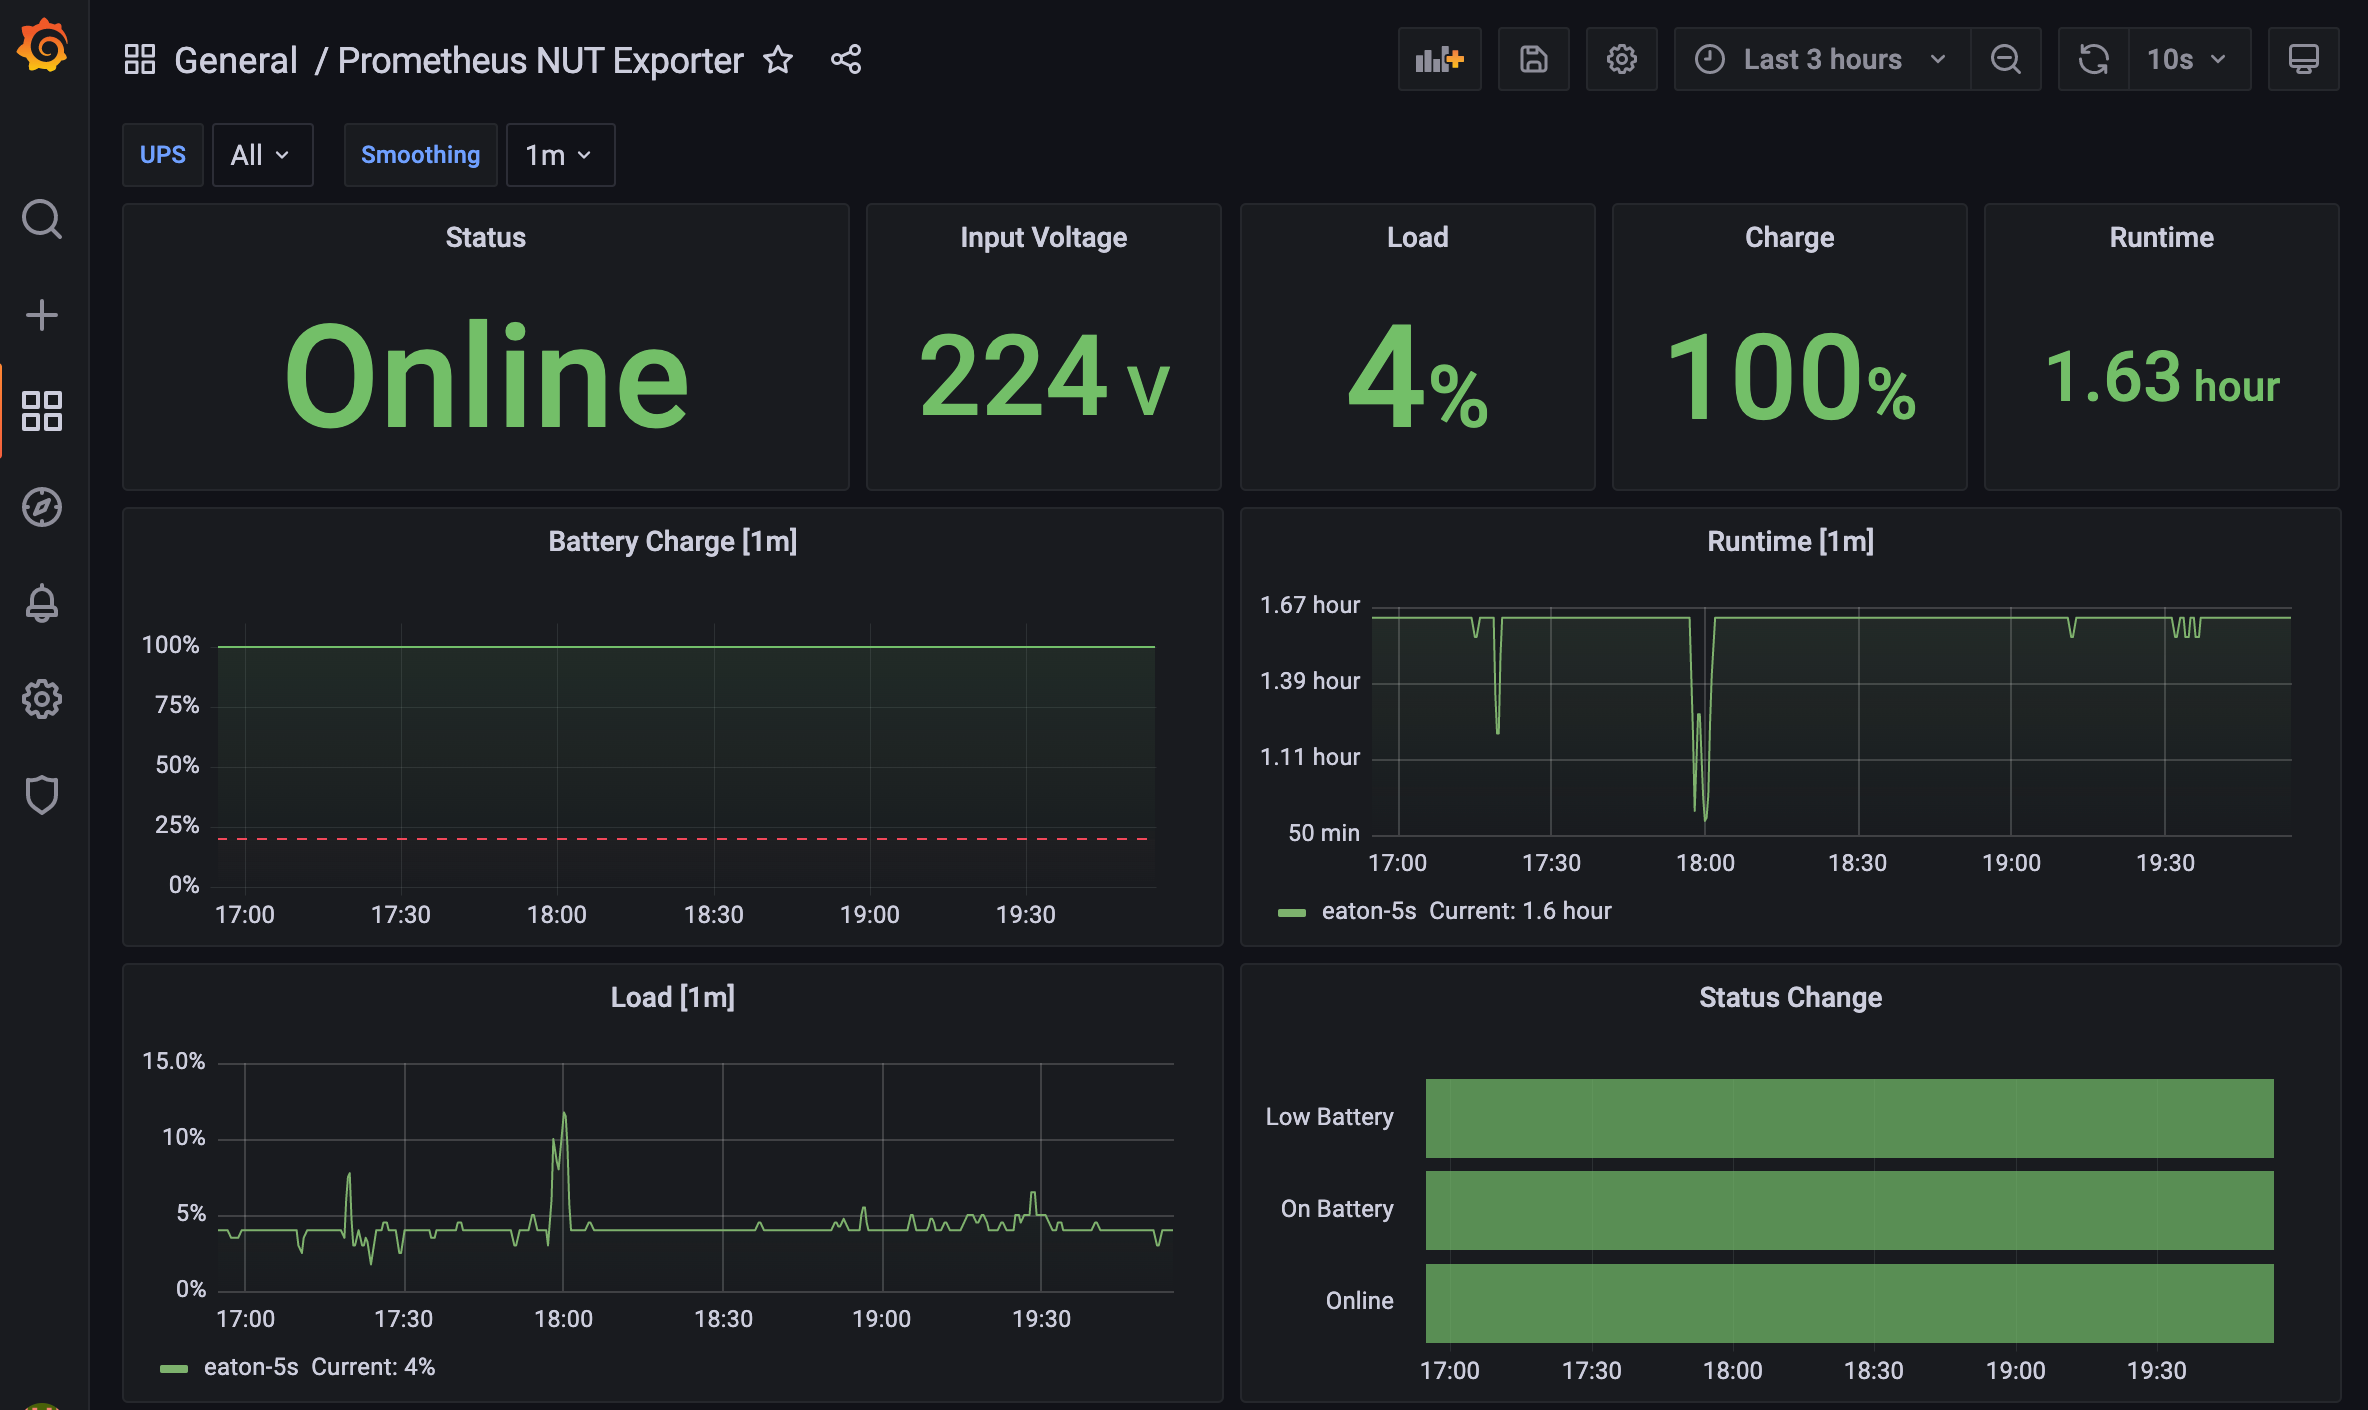
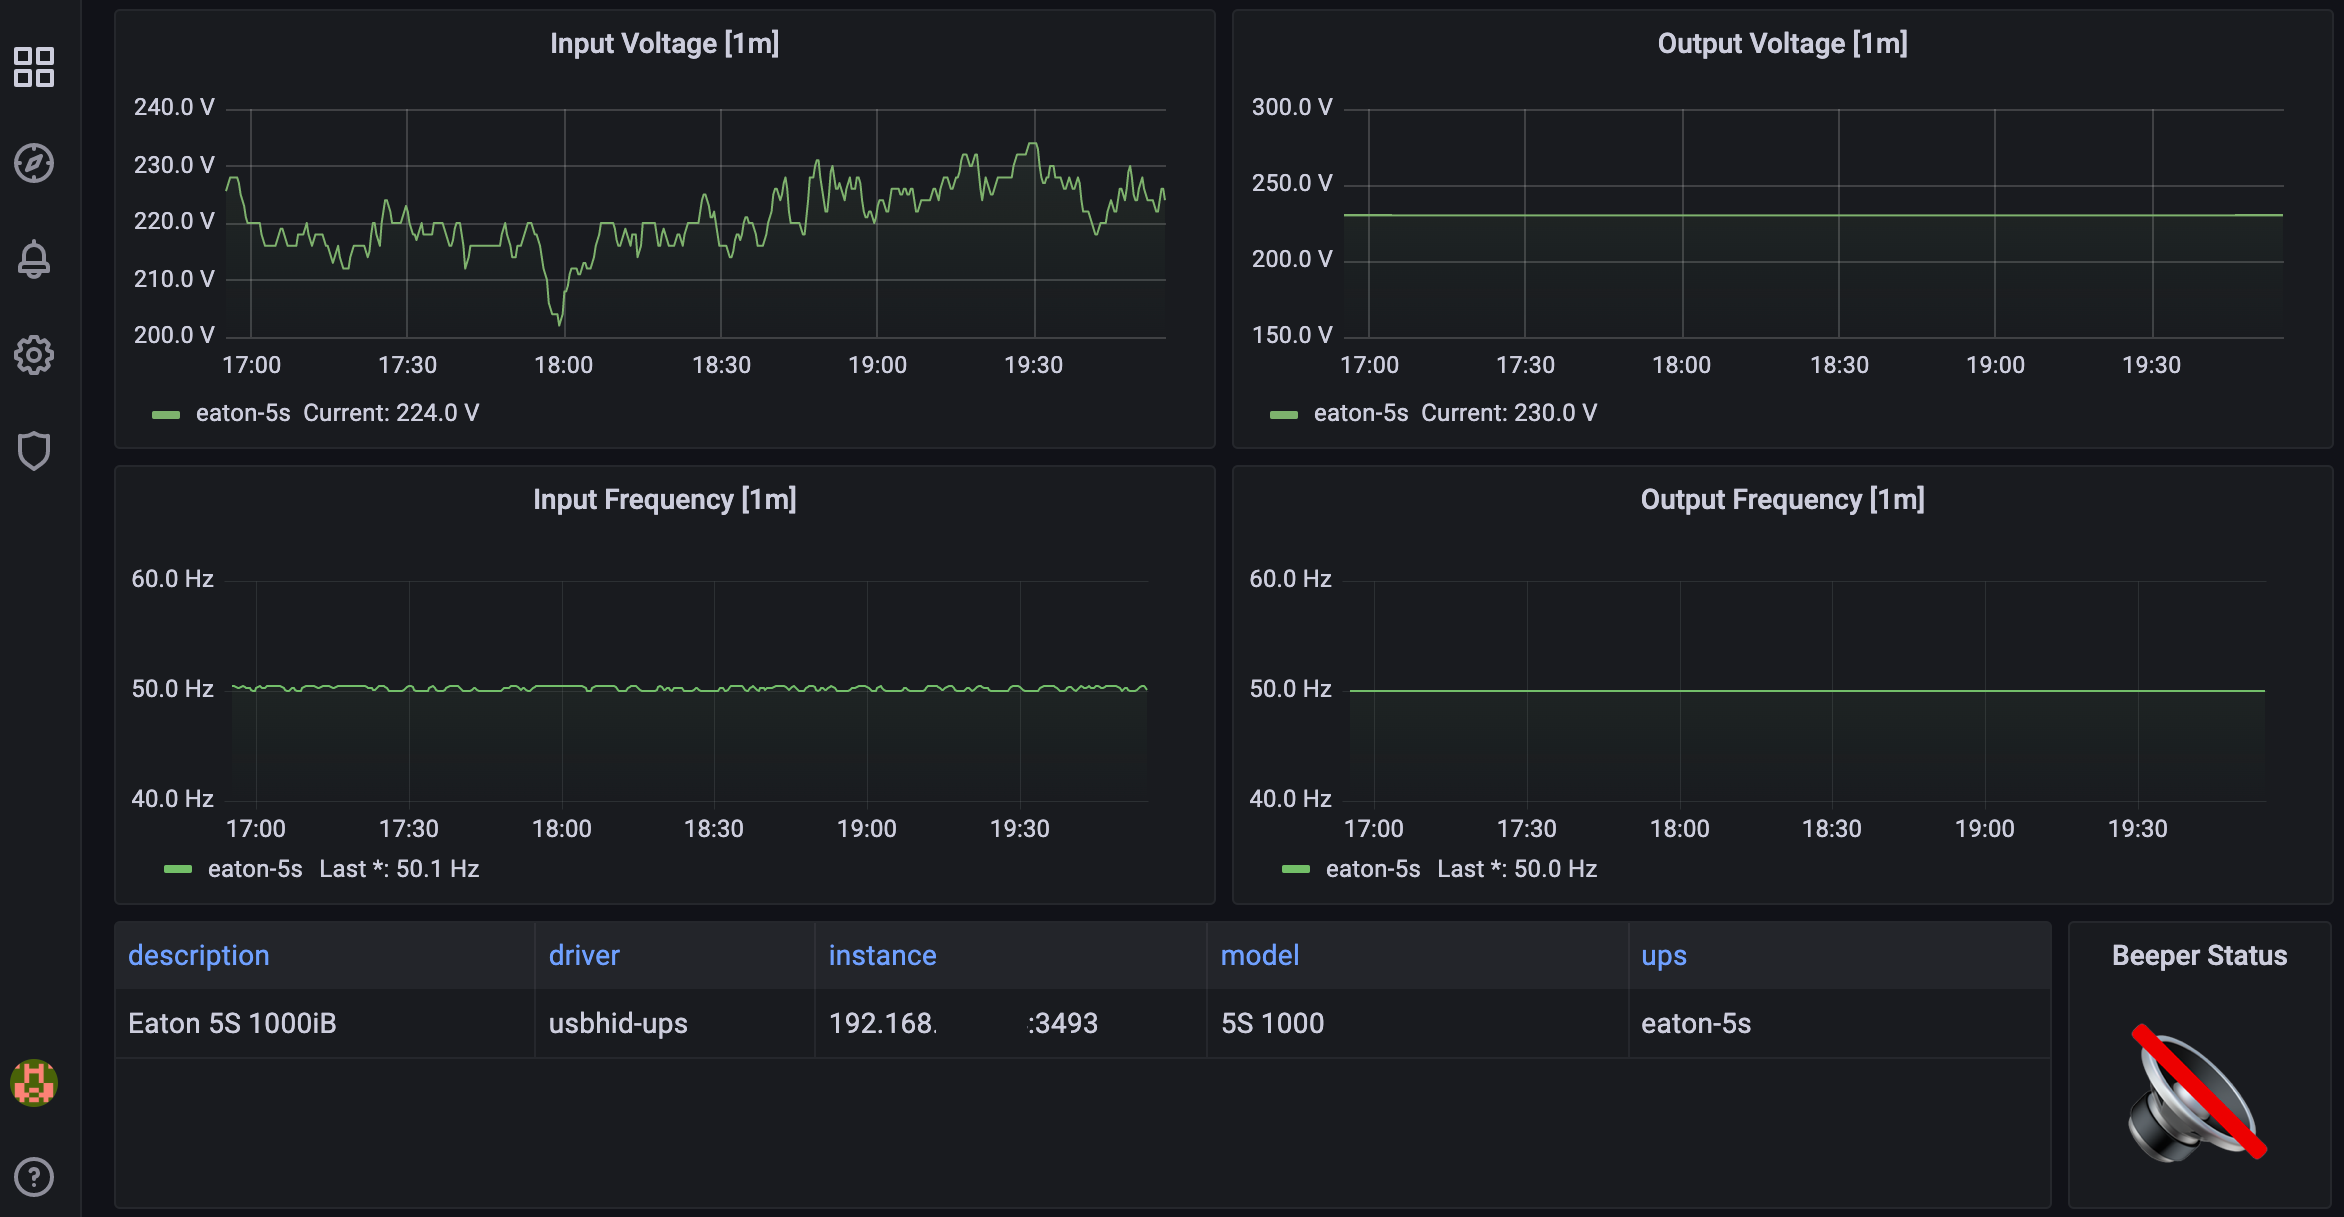
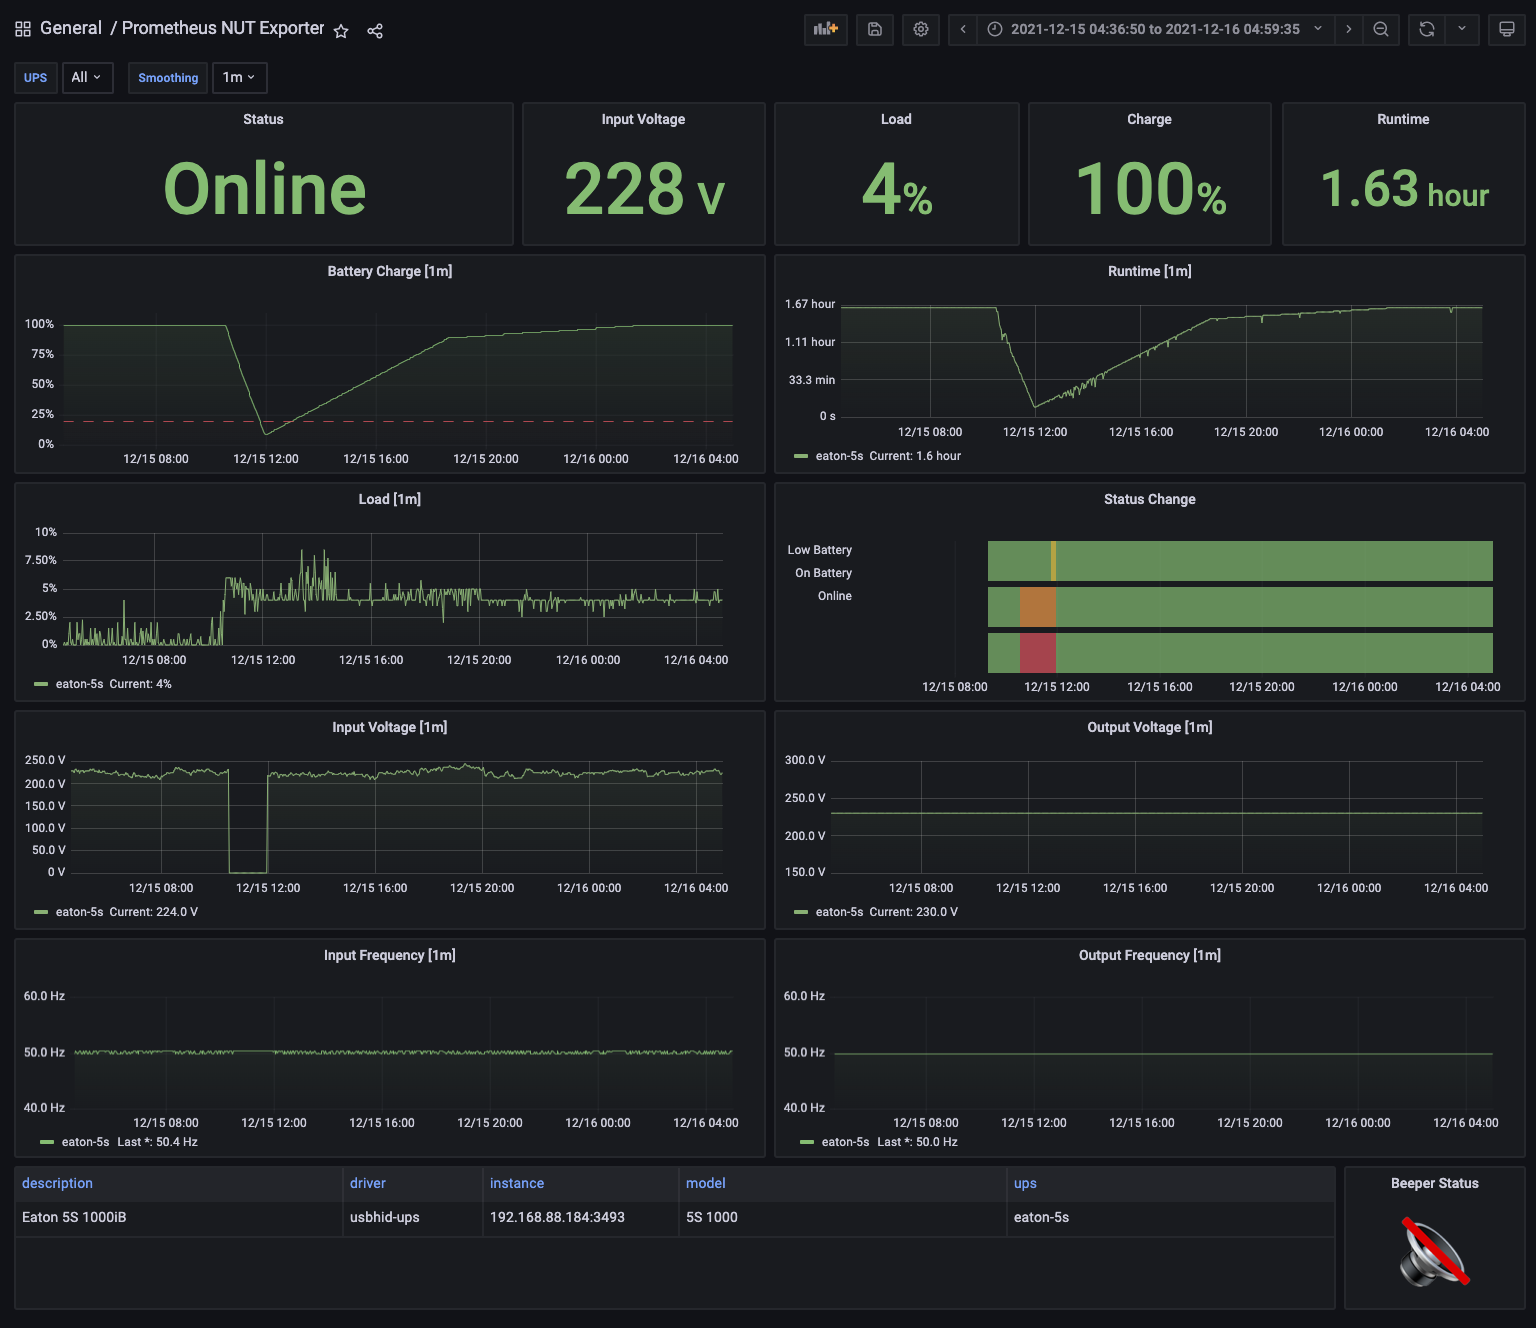
Monitor your UPS over NUT service. Uses HON95/prometheus-nut-exporter and DRuggeri/nut_exporter
Screenshots
Used Metrics 1313
network_ups_tools_ups_status
nut_battery_charge
nut_battery_charge_low
nut_battery_runtime_seconds
nut_beeper_status
nut_input_frequency_hertz
nut_input_voltage_volts
nut_load
nut_output_frequency_hertz
nut_output_voltage_volts
nut_status
nut_ups_info
smoothing_interval
Get Dashboard✕
Download
Copy to Clipboard