Yabeda Sidekiq 1,9181,918
1/29/2020
7/26/2021
3
>=6.6.0
Prometheus
Description
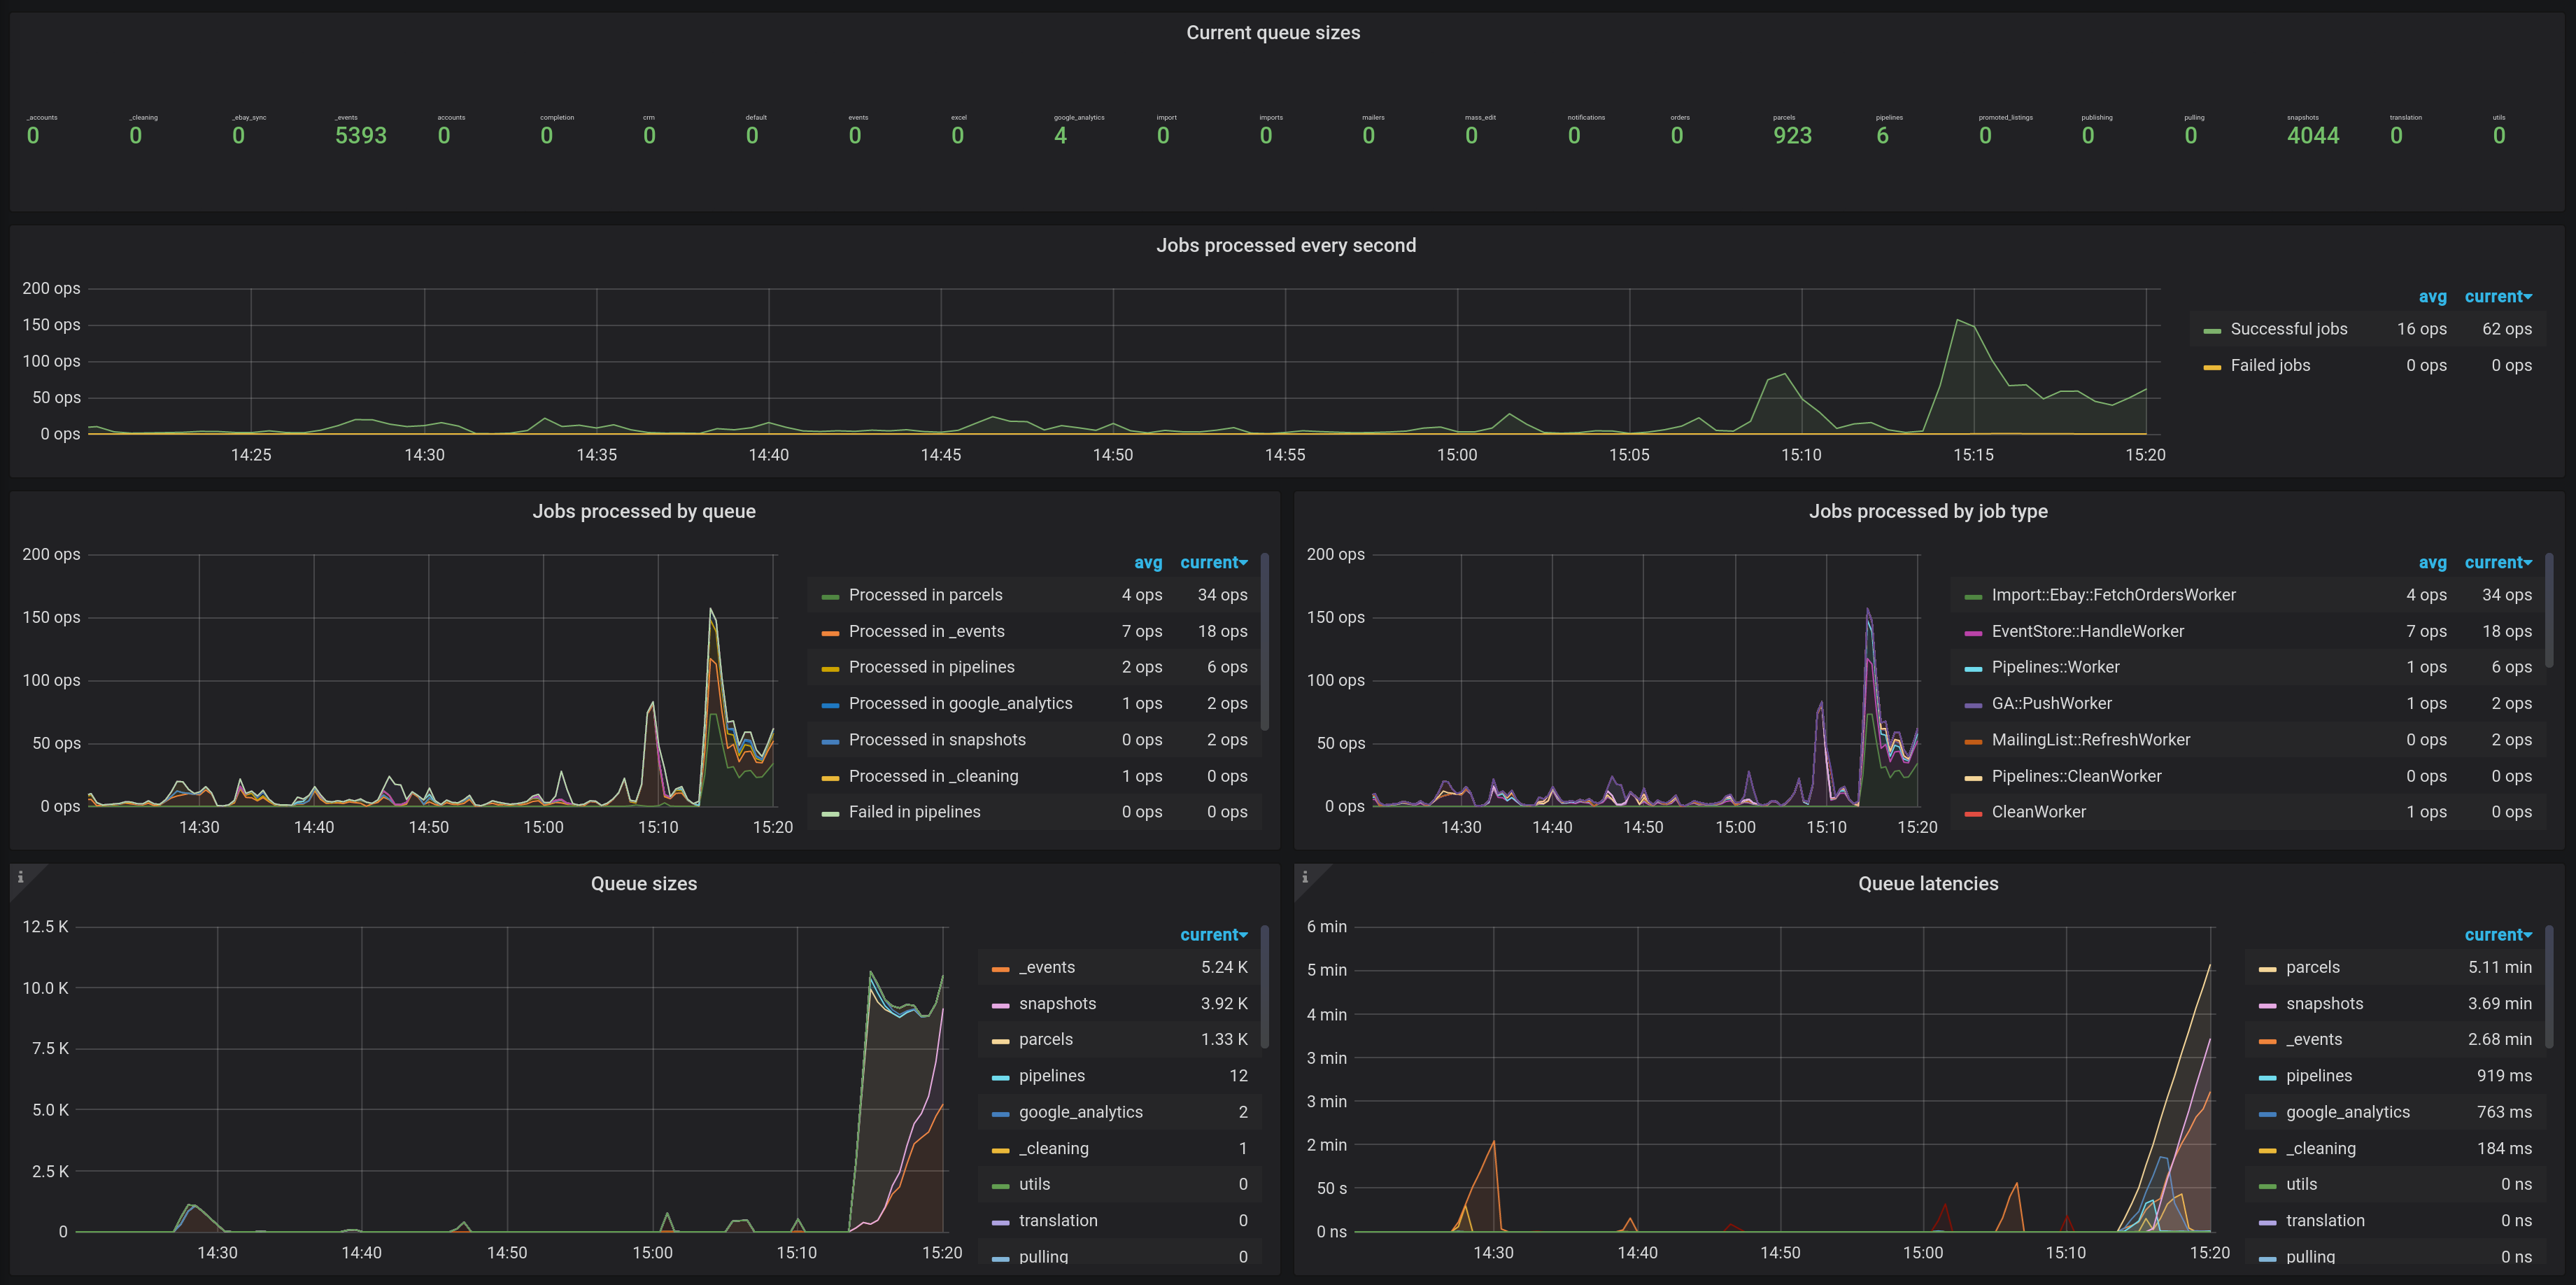
Example dashboard for metrics provided by yabeda-sidekiq gem for monitoring Sidekiq: simple and efficient background processing solution for Ruby.
Screenshots
Used Metrics 77
sidekiq_job_runtime_seconds_bucket
sidekiq_jobs_enqueued_total
sidekiq_jobs_failed_total
sidekiq_jobs_retry_count
sidekiq_jobs_success_total
sidekiq_jobs_waiting_count
sidekiq_queue_latency
Get Dashboard✕
Download
Copy to Clipboard