WSO2 Integration Cluster Metrics
1,564

Created 8/6/2020
Updated 11/19/2025
Revision 2
Categories
Web Servers
Datasources
PrometheusLoki

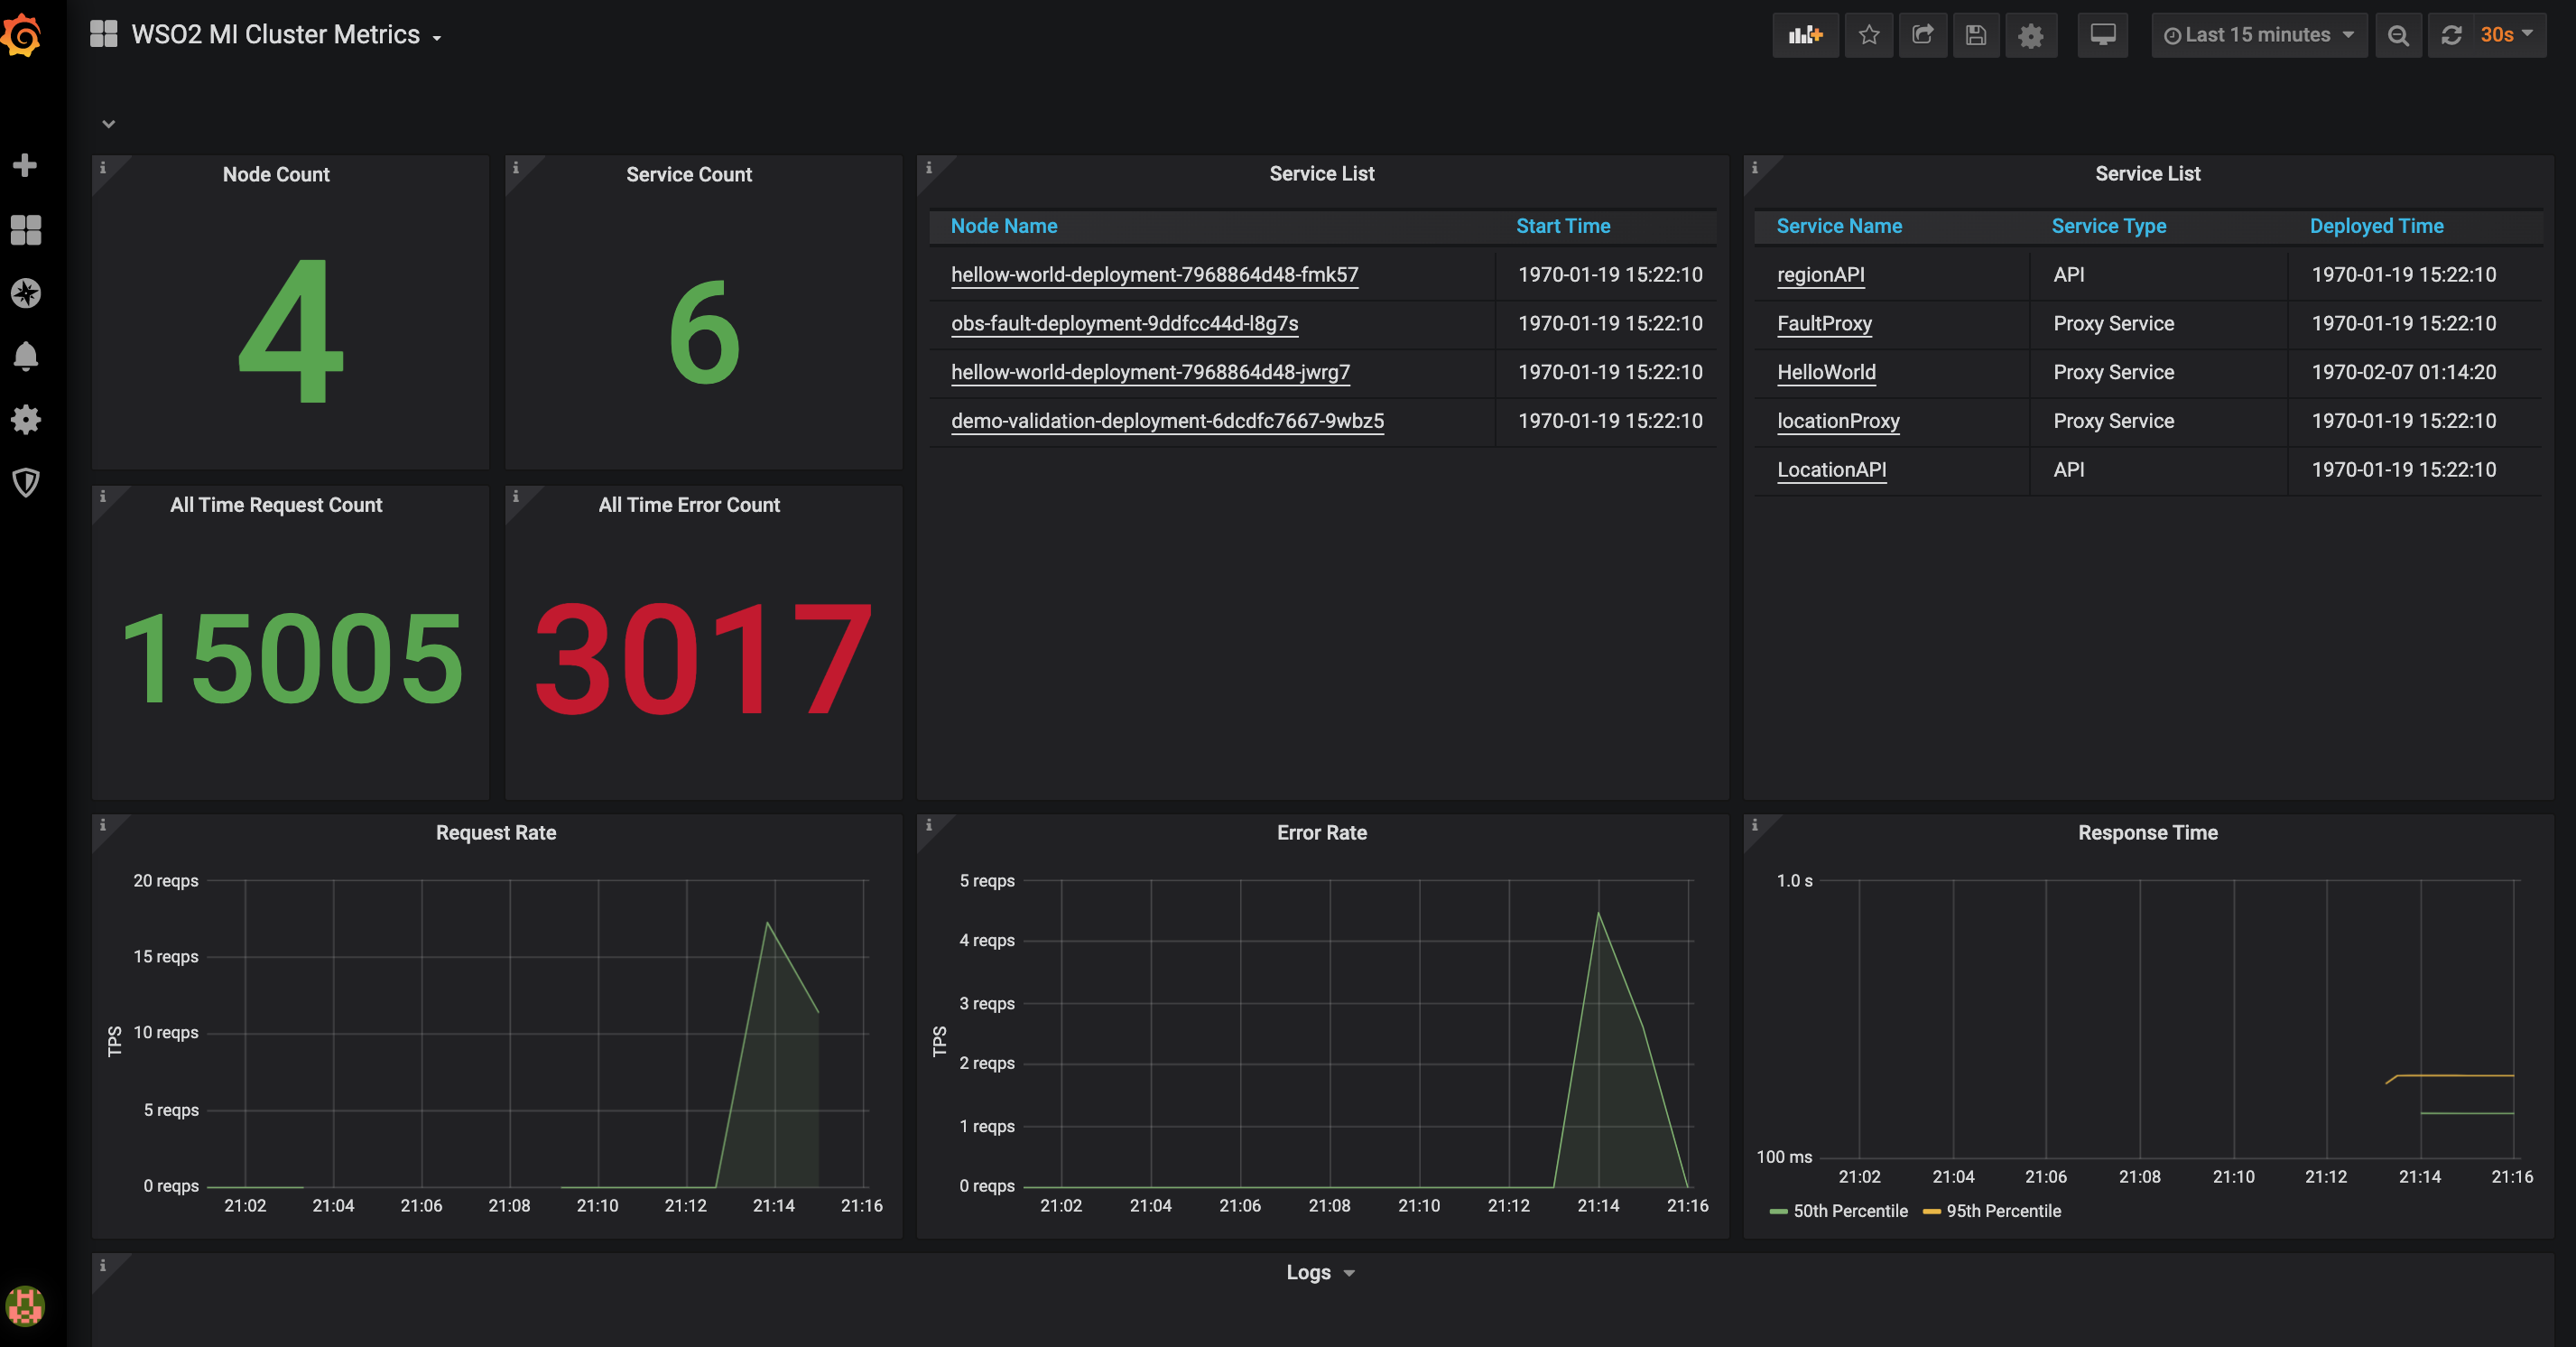
This Dashboard provides an overview of WSO2 integration cluster and works as a centralised dashboard. Dashboard will display following details about the cluster.

  • Deployed node count and list
  • Deployed service count and list
  • Request count and rate
  • Error request count and rate
  • 50th and 95th percentiles of response time
  • Error logs
Get Dashboard
Download
Copy to Clipboard
Source Grafana.com

Used Metrics 2

  • wso2_integration_server_up

  • wso2_integration_service_up