WSO2 Inbound Endpoint Metrics
1,795

Created 8/25/2020
Updated 11/19/2025
Revision 2
Categories
Web Servers
Datasources
PrometheusLoki

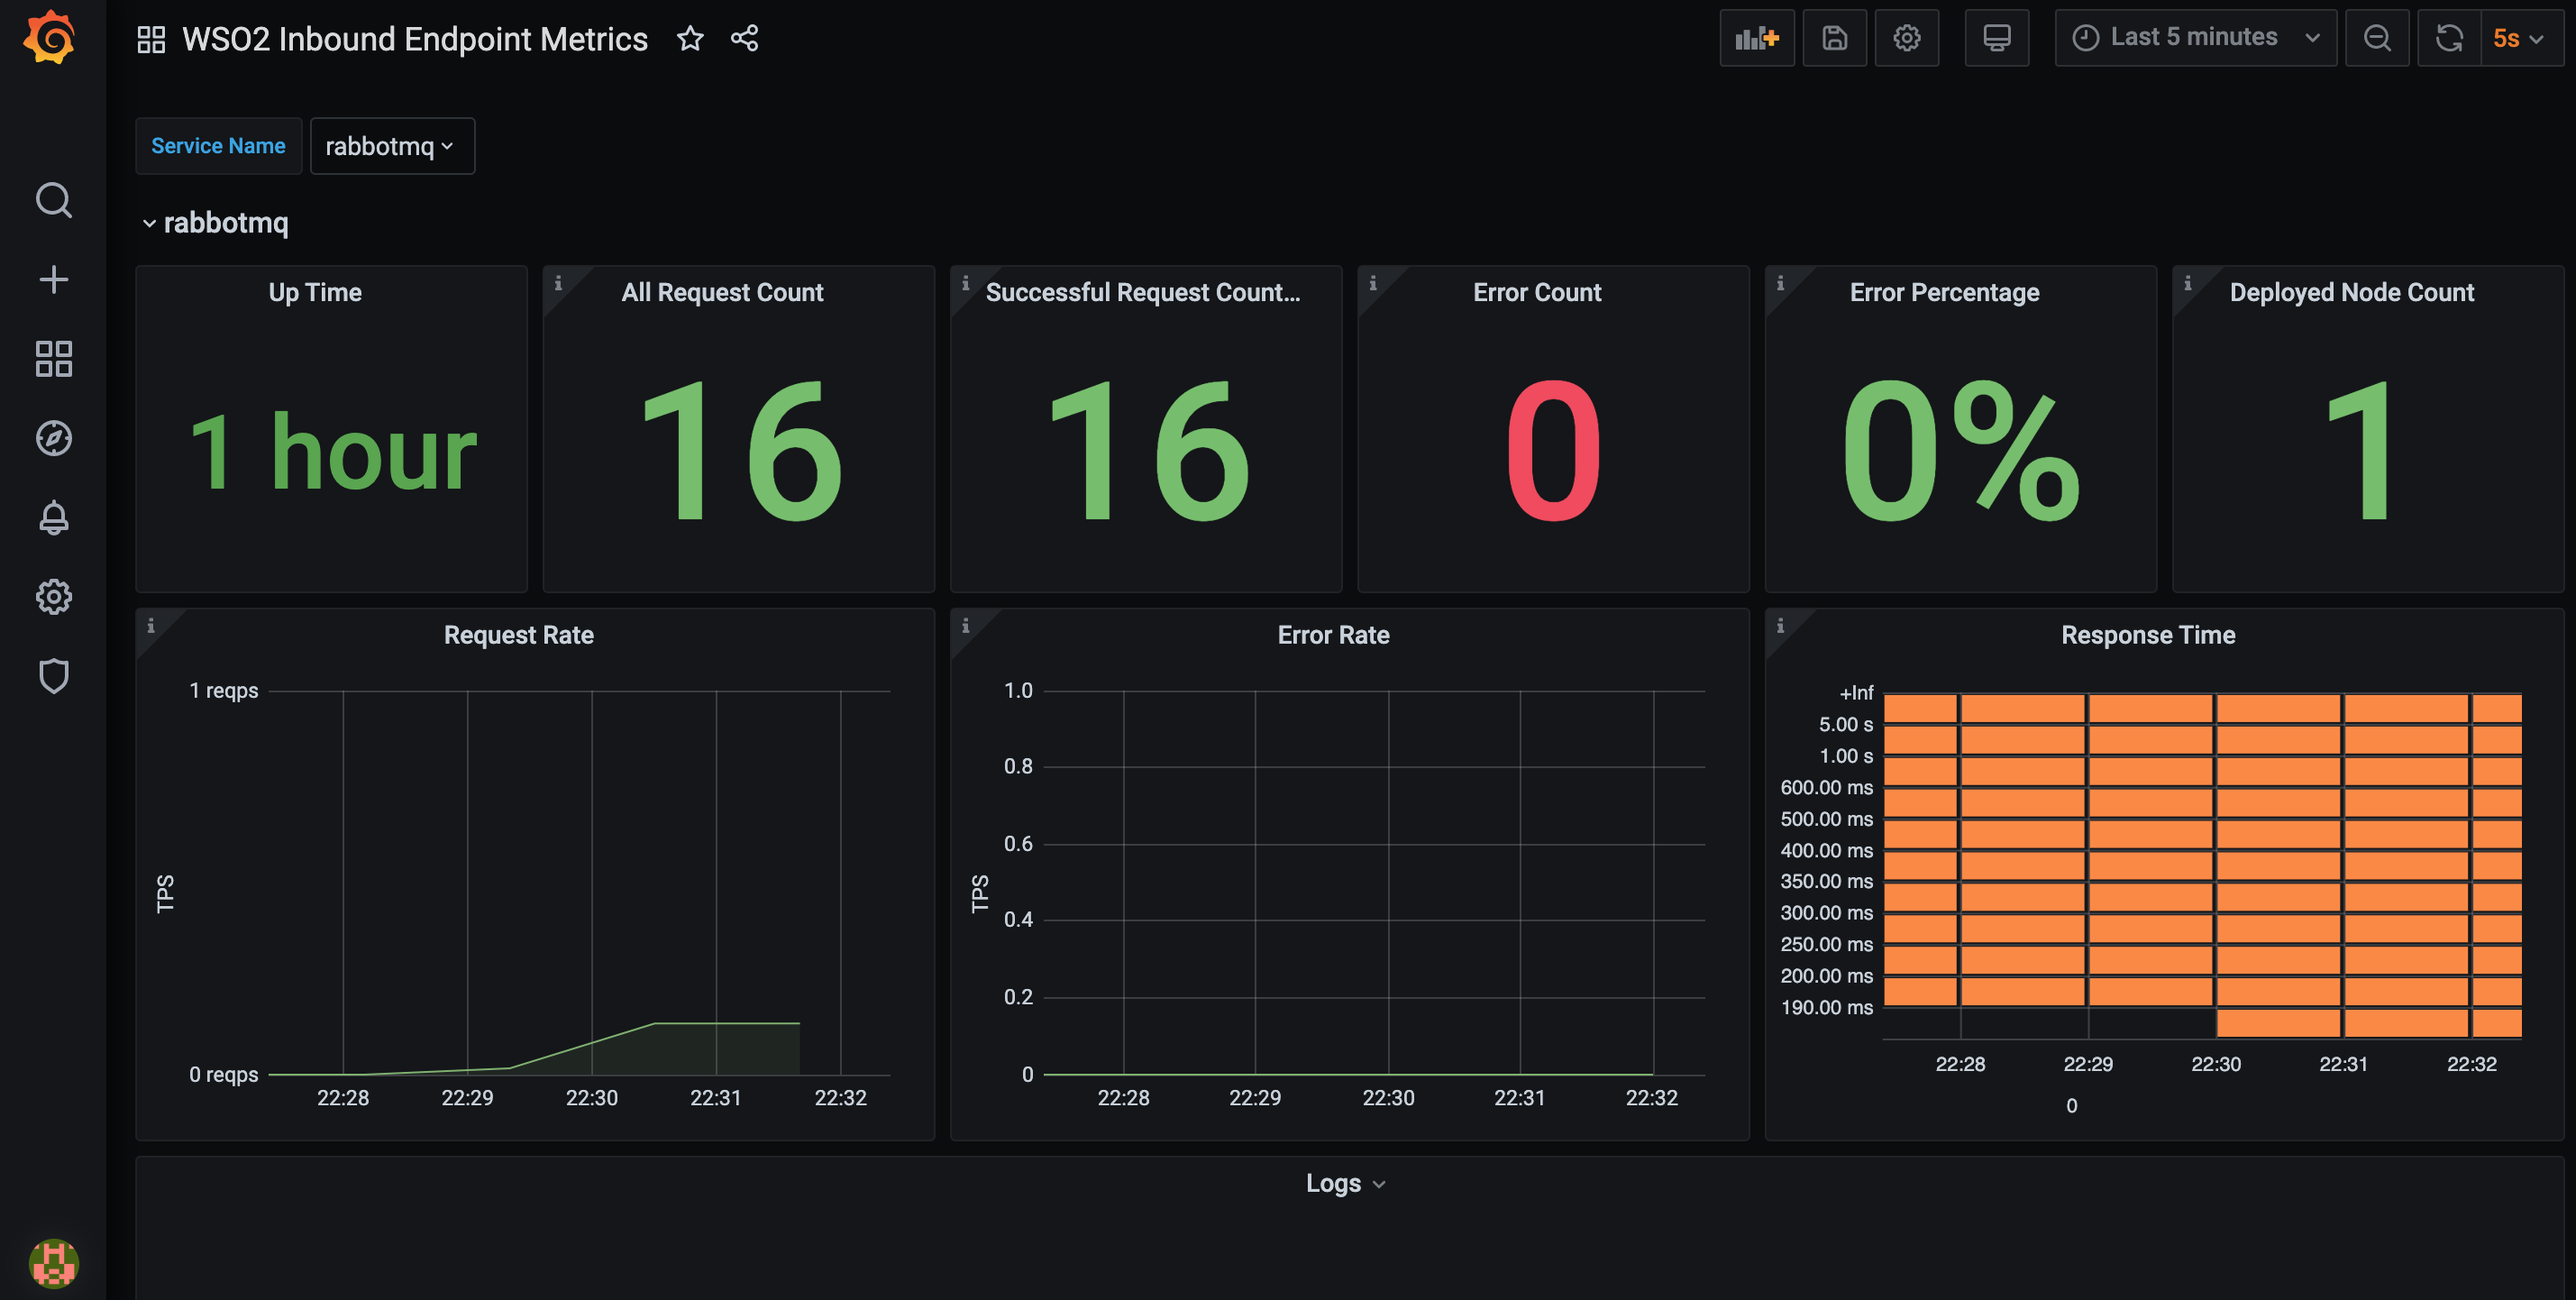
This Dashboard provides an overview of inbound endpoints deployed in Enterprise Integrator Cluster. It will have dynamic panels for each inbound endpoint deployed in Enterprise Integrator cluster and user have the ability to choose the inbound endpoint that they want to monitor using the drop down. Following stats are displayed in the inbound endpoint dashboards.

  • Up Time
  • All Request Count
  • Successful Request Count
  • Error Count
  • Error Percentage
  • Deployed Node Count: Number of nodes, service is deployed
  • Request Rate
  • Error Rate
  • Response Time : This will be show as a heat map using recorded histograms. If tracing is enabled widget will have a link to redirect users to Jaeger UI
Get Dashboard
Download
Copy to Clipboard
Source Grafana.com

Used Metrics 5

  • wso2_integration_service_up

  • wso2_integration_inbound_endpoint_request_count_total

  • wso2_integration_inbound_endpoint_request_count_error_total

  • wso2_integration_proxy_inbound_endpoint_count_total

  • wso2_integration_inbound_endpoint_latency_seconds_bucket