WSO2 API Metrics 2,1202,120
8/25/2020
11/19/2025
3
Web Servers
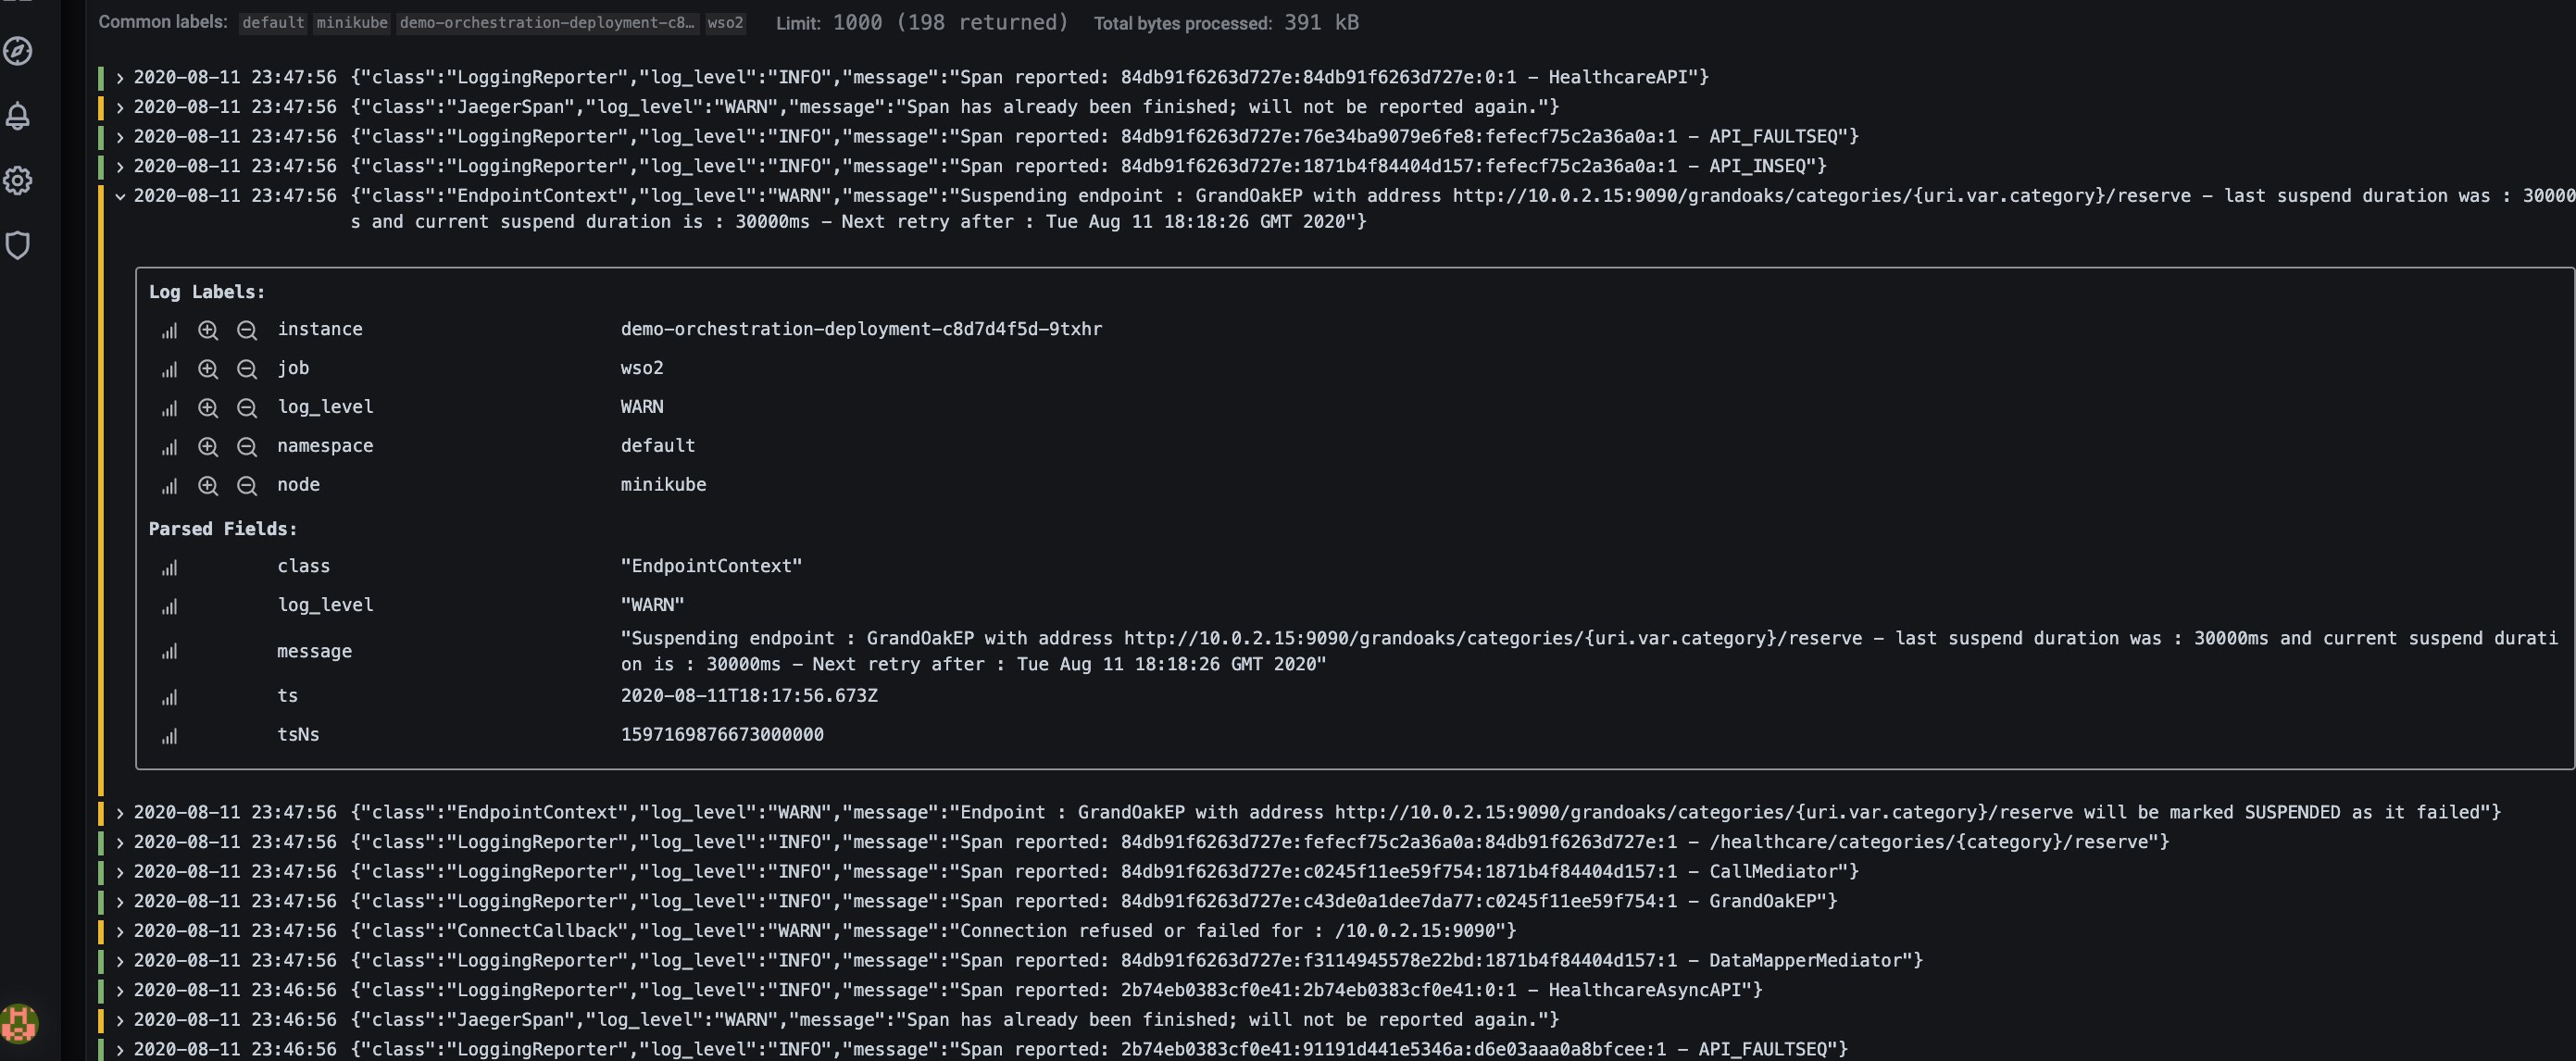
PrometheusLoki
Description
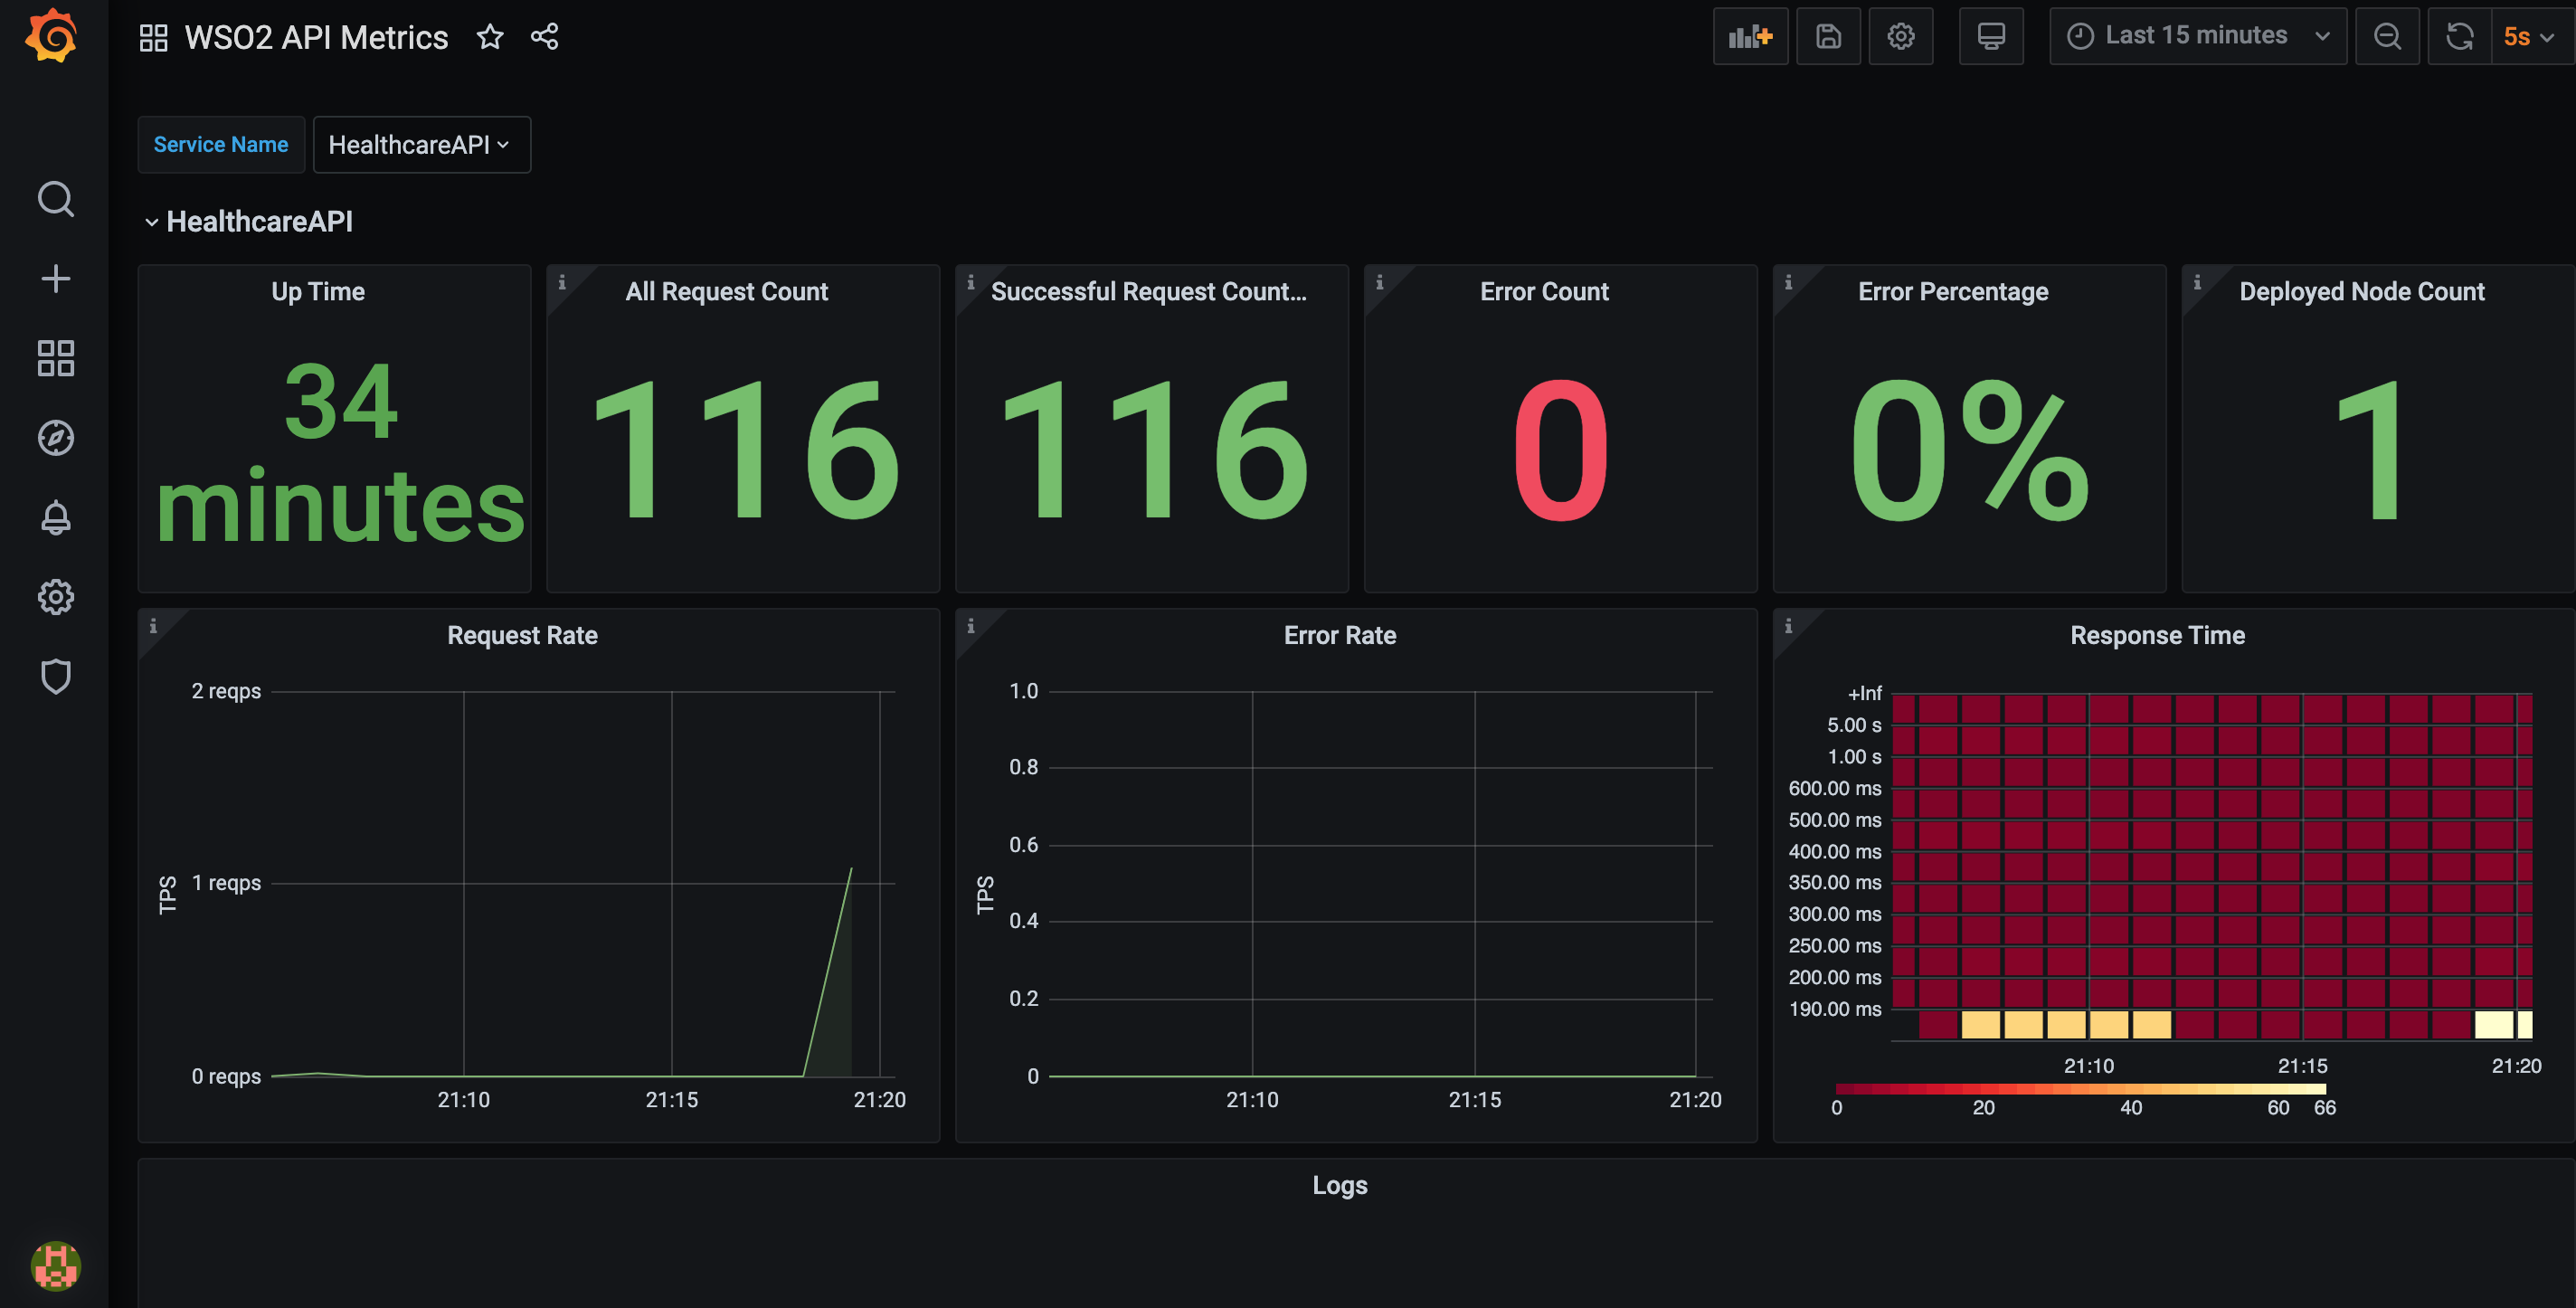
This Dashboard provides an overview of API services deployed in Enterprise Integrator Cluster.
Screenshots
Used Metrics 66
wso2_integration_api_latency_seconds_bucket
wso2_integration_api_request_count_error_total
wso2_integration_api_request_count_total
wso2_integration_proxy_request_count_error_total
wso2_integration_proxy_request_count_total
wso2_integration_service_up
Get Dashboard✕
Download
Copy to Clipboard