Windows System Overview 9,2519,251
10/23/2020
10/23/2020
1
Host Metrics
>=7.2.1
Prometheus
Description
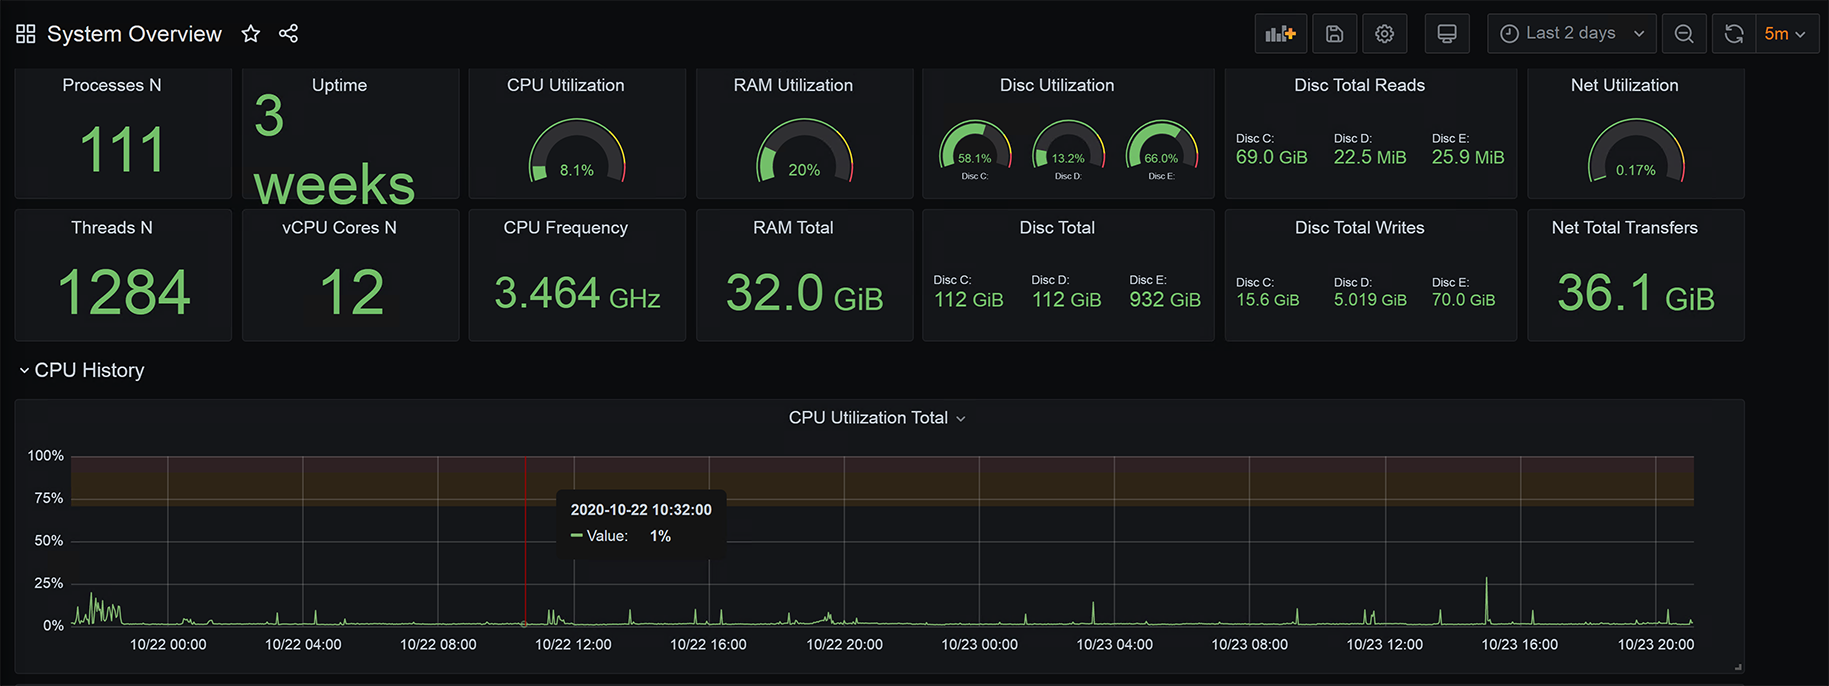
A dashboard utilizing metrics collected via "windows_exporter" for Prometheus.
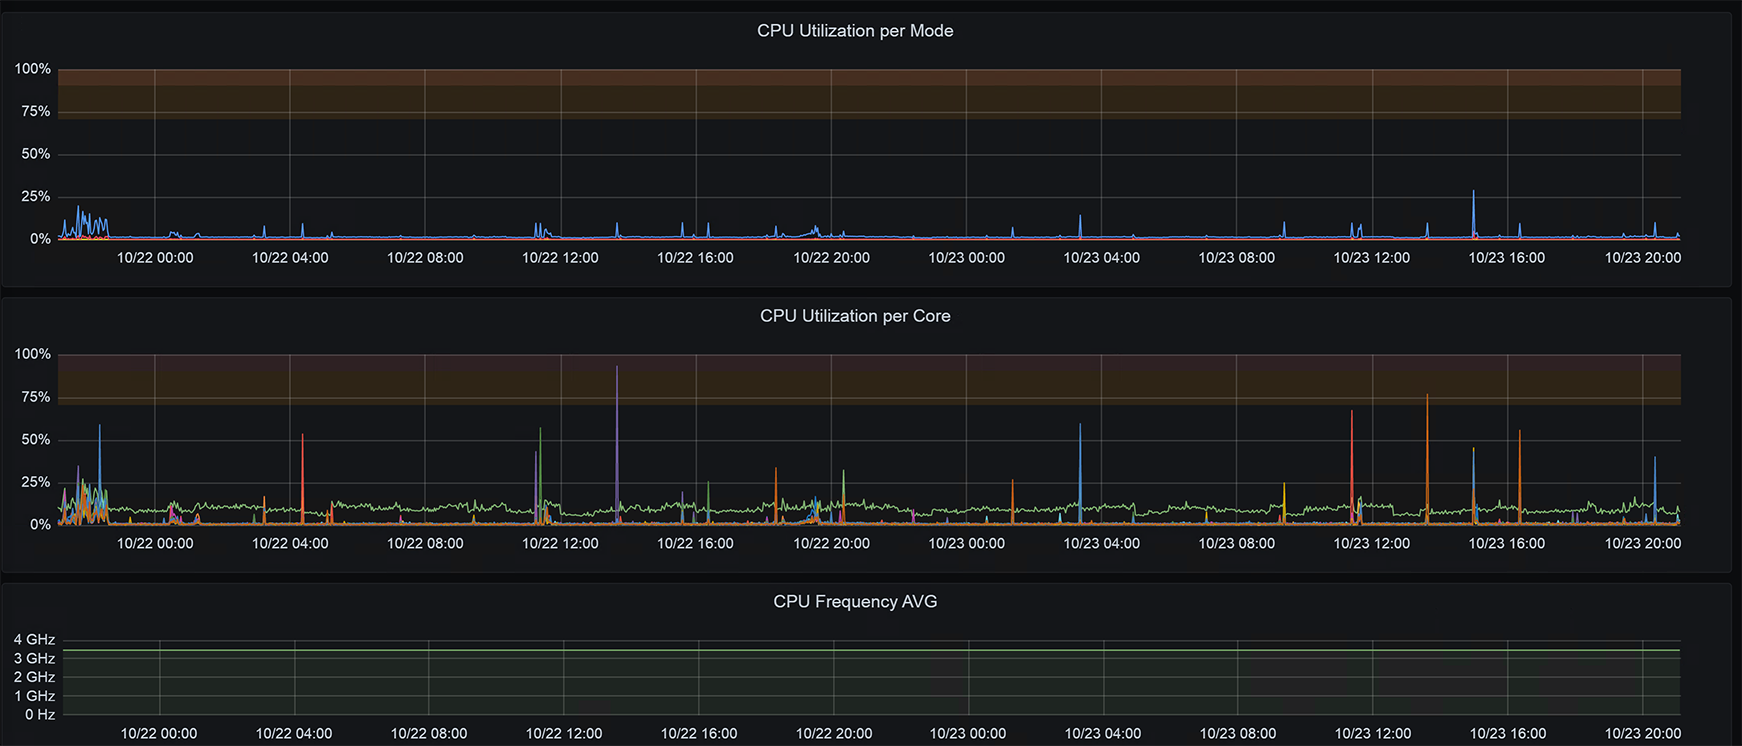
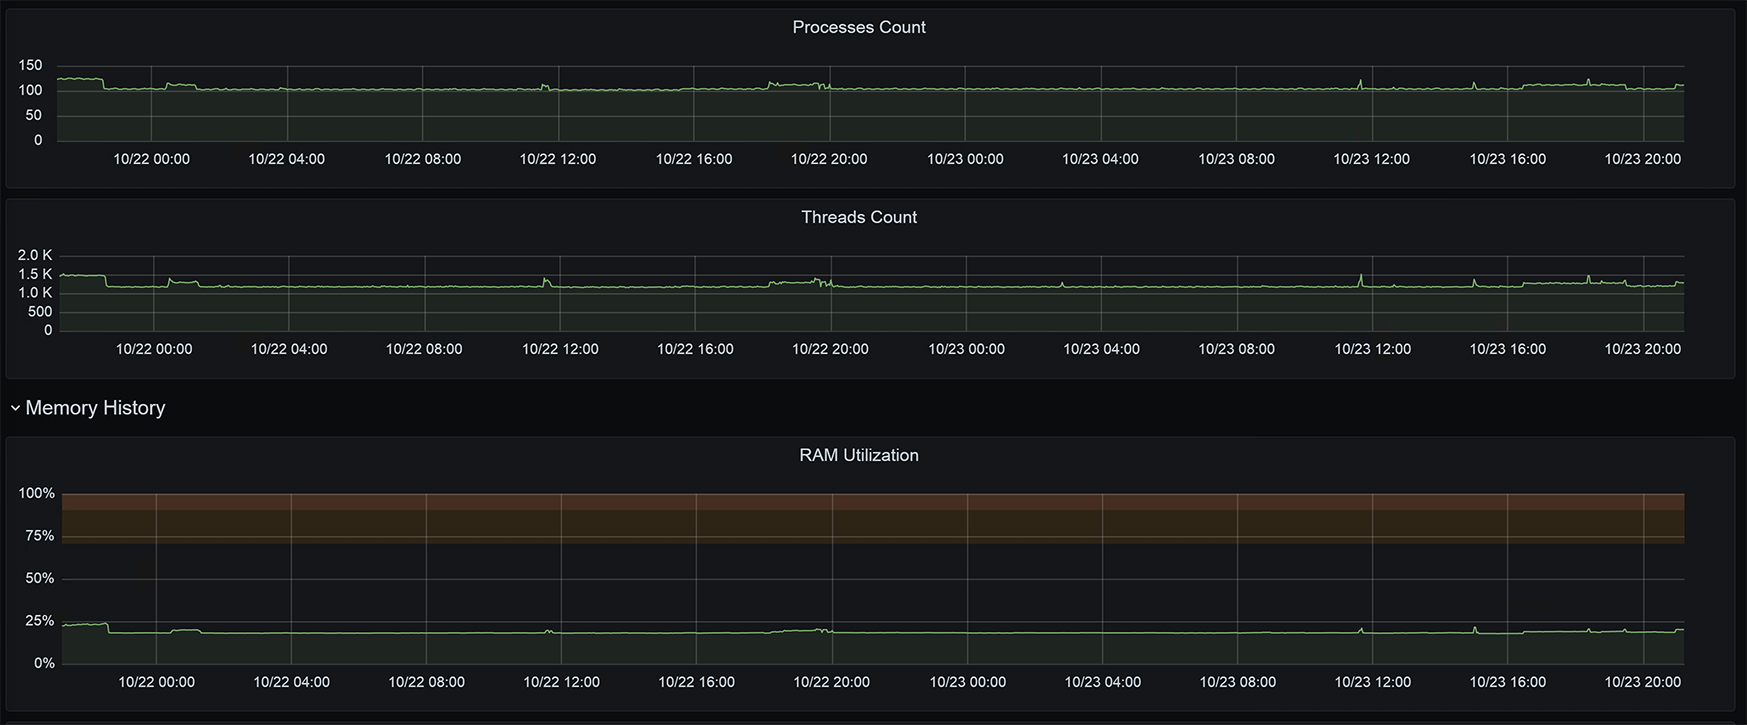
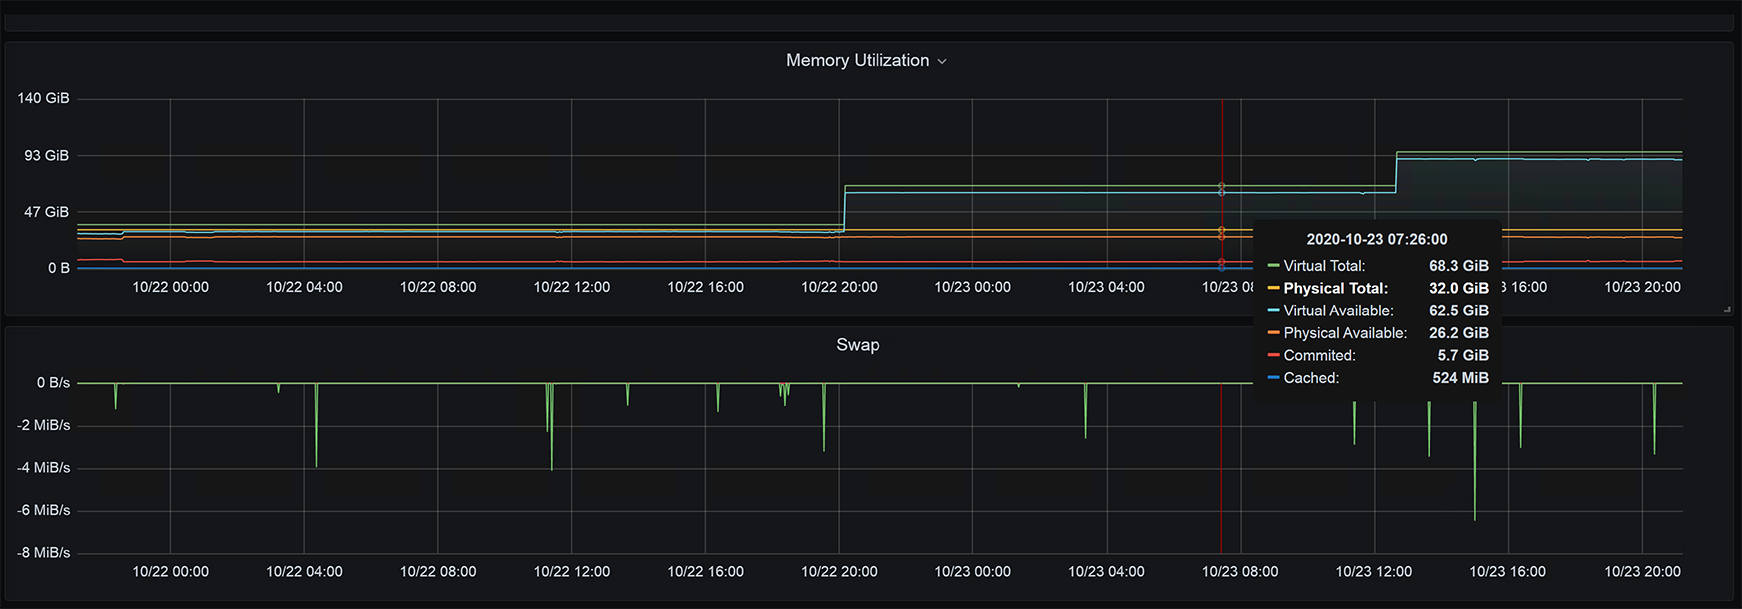
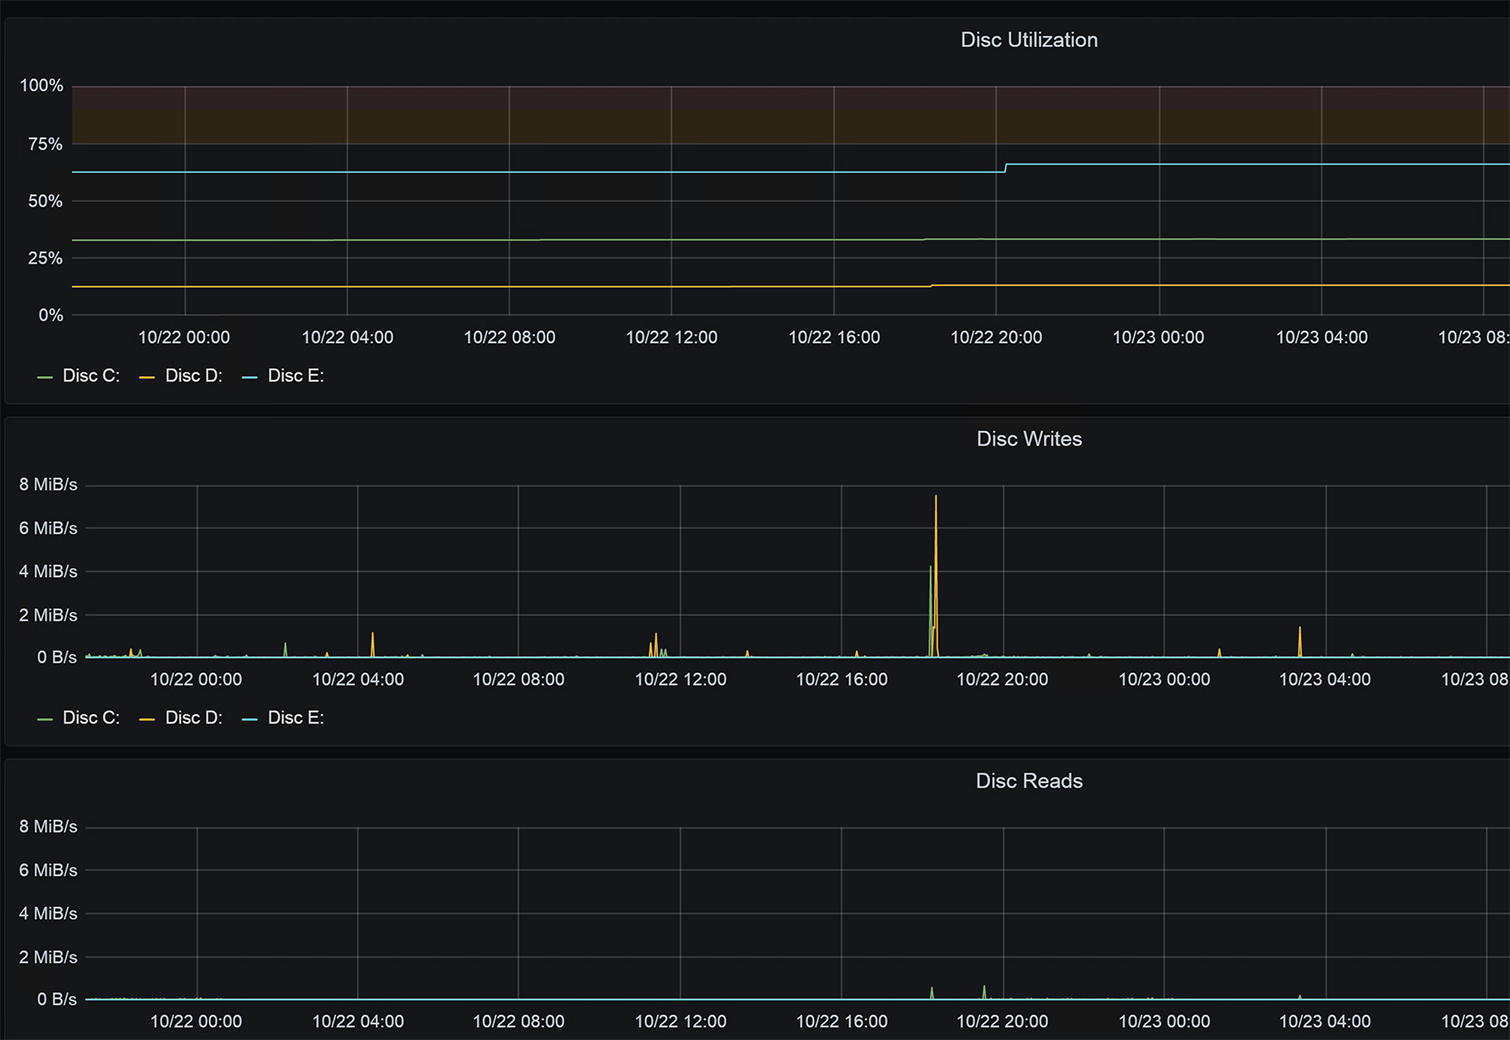
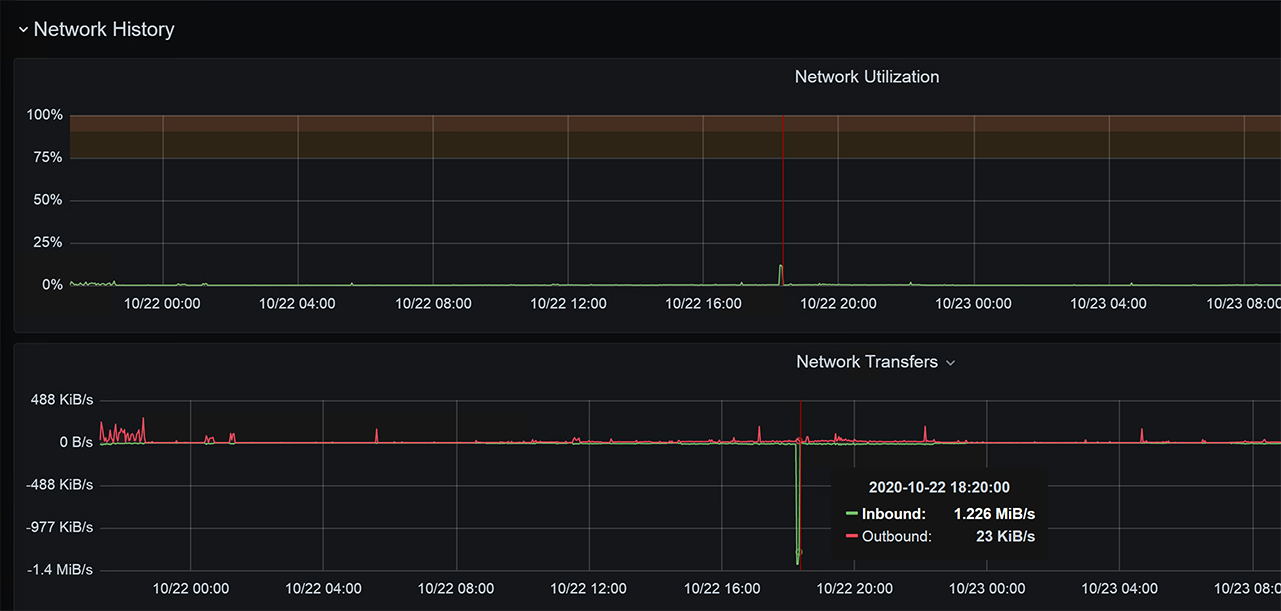
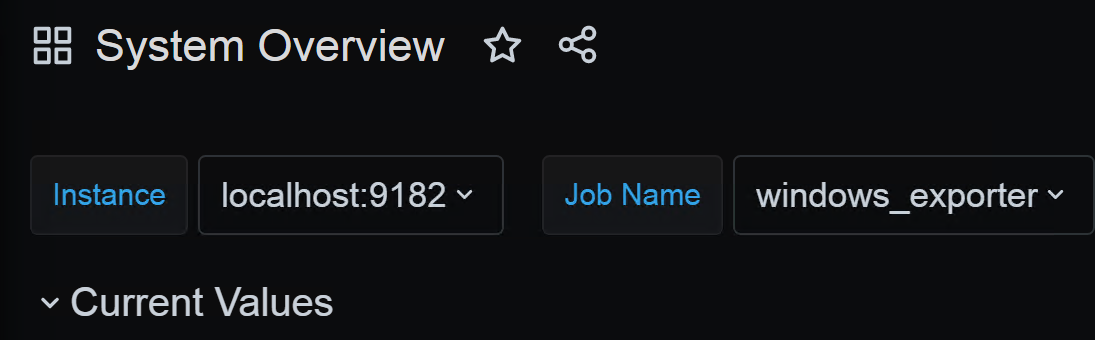
Screenshots
Used Metrics 2222
windows_cpu_core_frequency_mhz
windows_cpu_time_total
windows_cs_logical_processors
windows_cs_physical_memory_bytes
windows_logical_disk_free_bytes
windows_logical_disk_read_bytes_total
windows_logical_disk_size_bytes
windows_logical_disk_write_bytes_total
windows_memory_cache_bytes
windows_memory_committed_bytes
windows_memory_swap_pages_read_total
windows_memory_swap_pages_written_total
windows_net_bytes_received_total
windows_net_bytes_sent_total
windows_net_bytes_total
windows_net_current_bandwidth
windows_os_physical_memory_free_bytes
windows_os_processes
windows_os_virtual_memory_bytes
windows_os_virtual_memory_free_bytes
windows_system_system_up_time
windows_system_threads
Get Dashboard✕
Download
Copy to Clipboard