Windows Services & Processes 12,03912,039
10/23/2020
10/23/2020
1
Host Metrics
>=7.2.1
Prometheus
Description
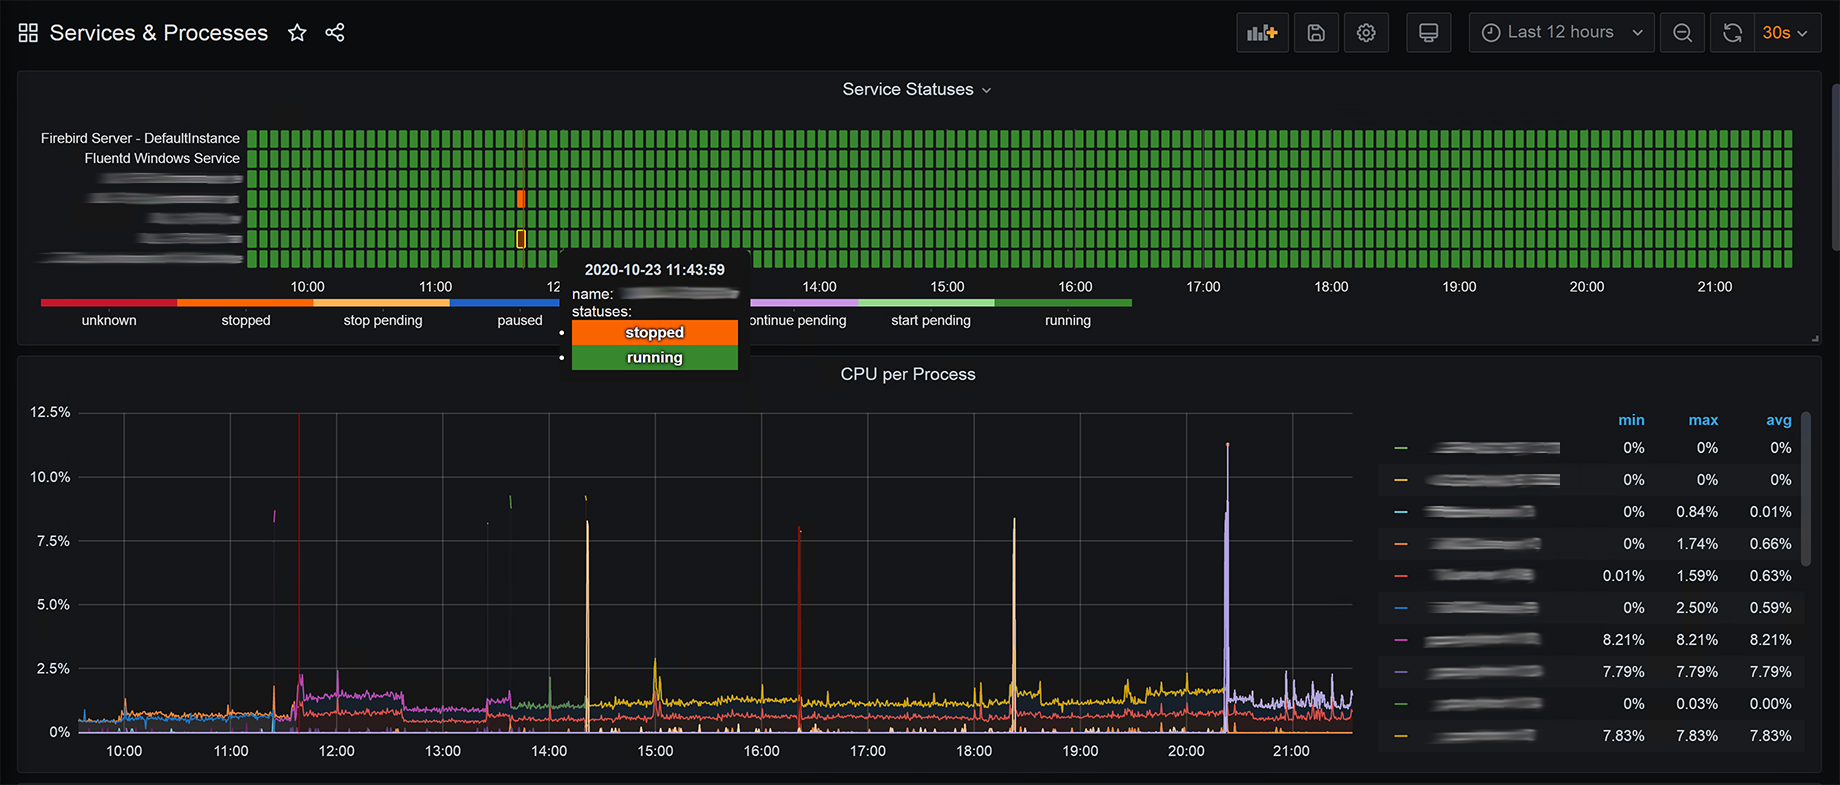
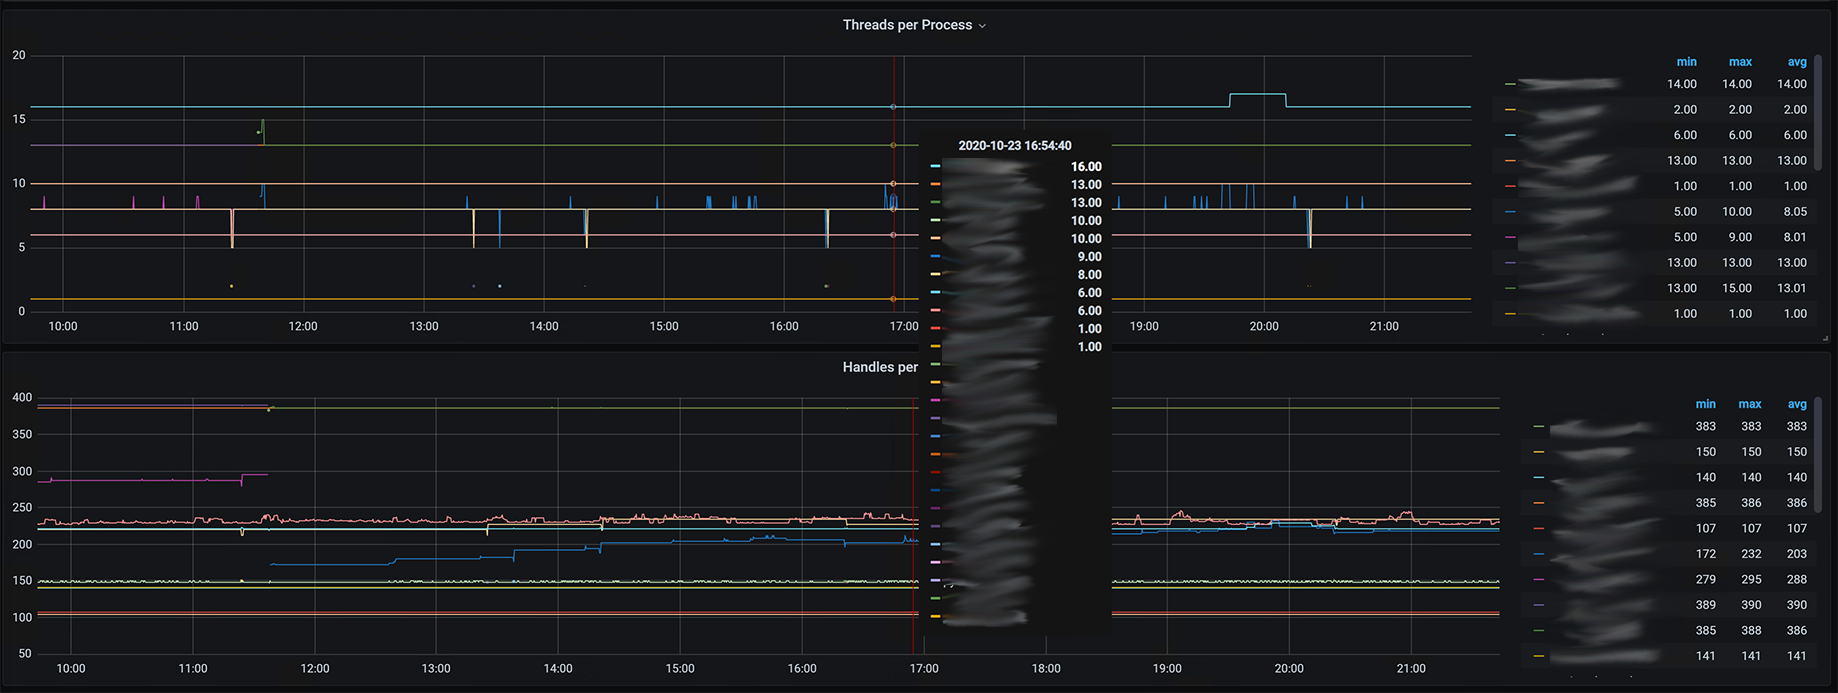
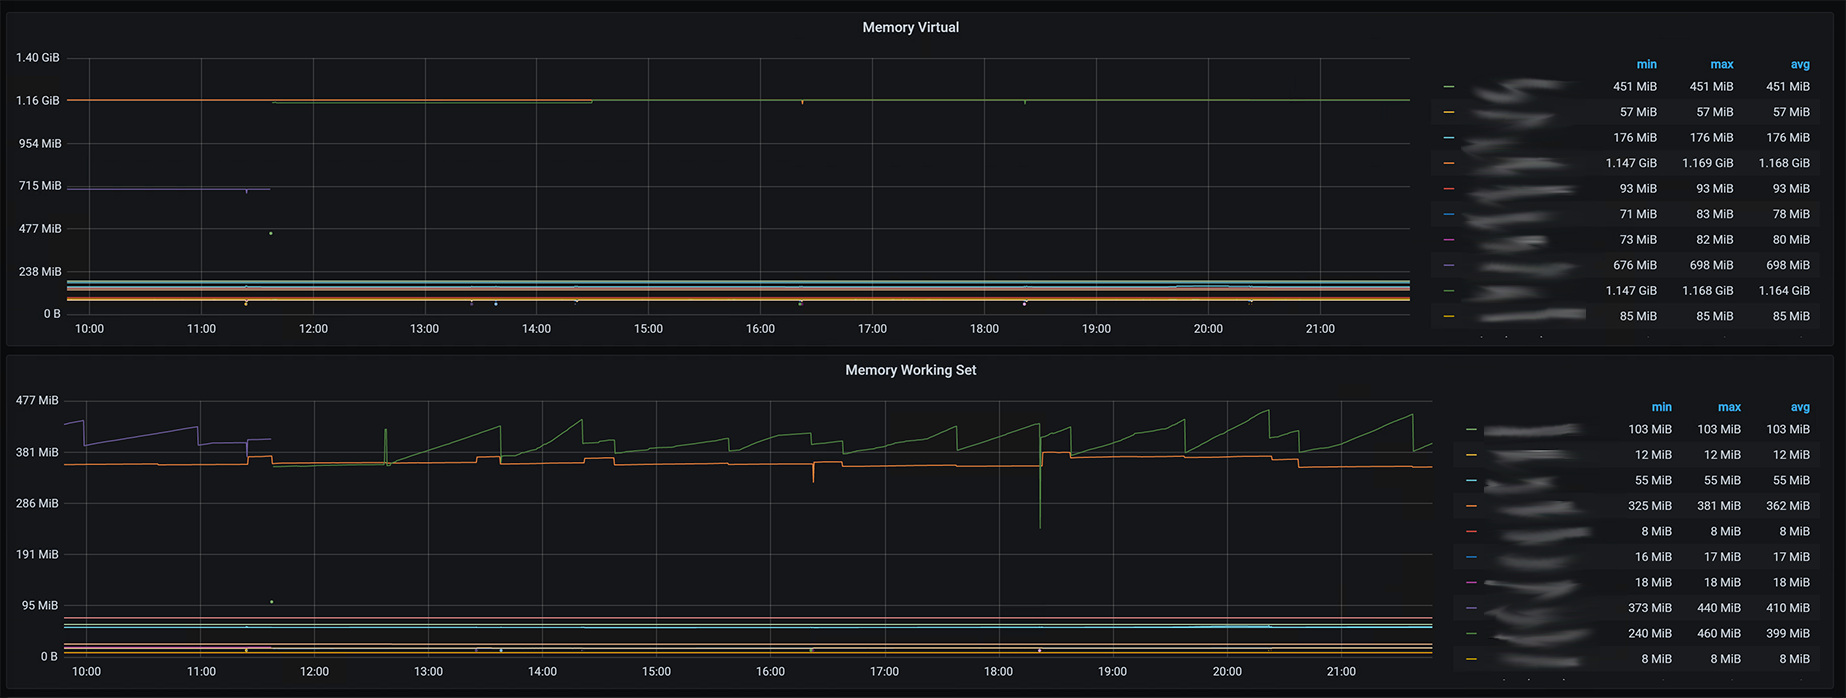
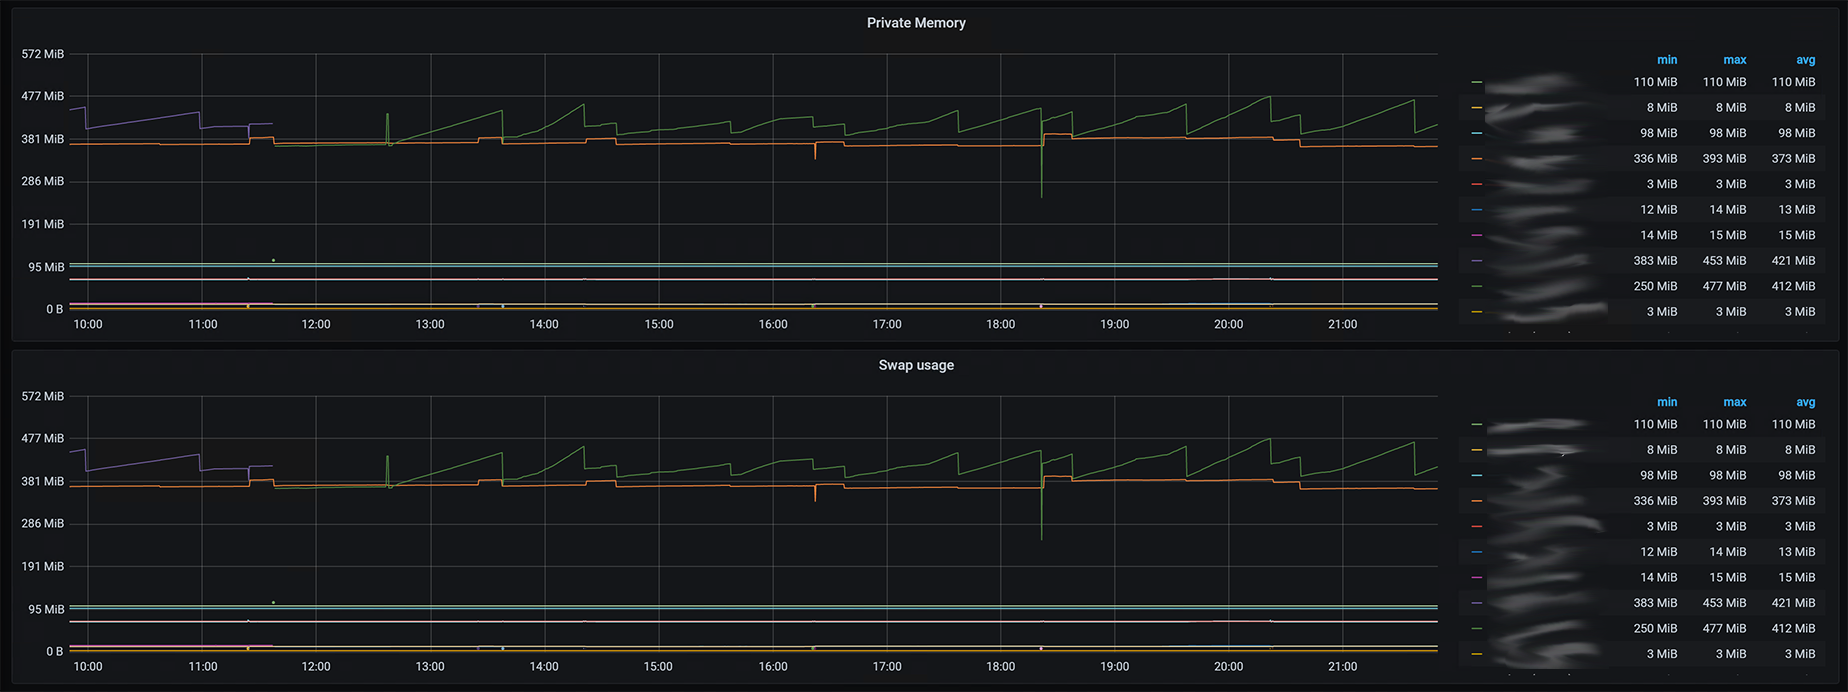
History of service statuses & process metrics
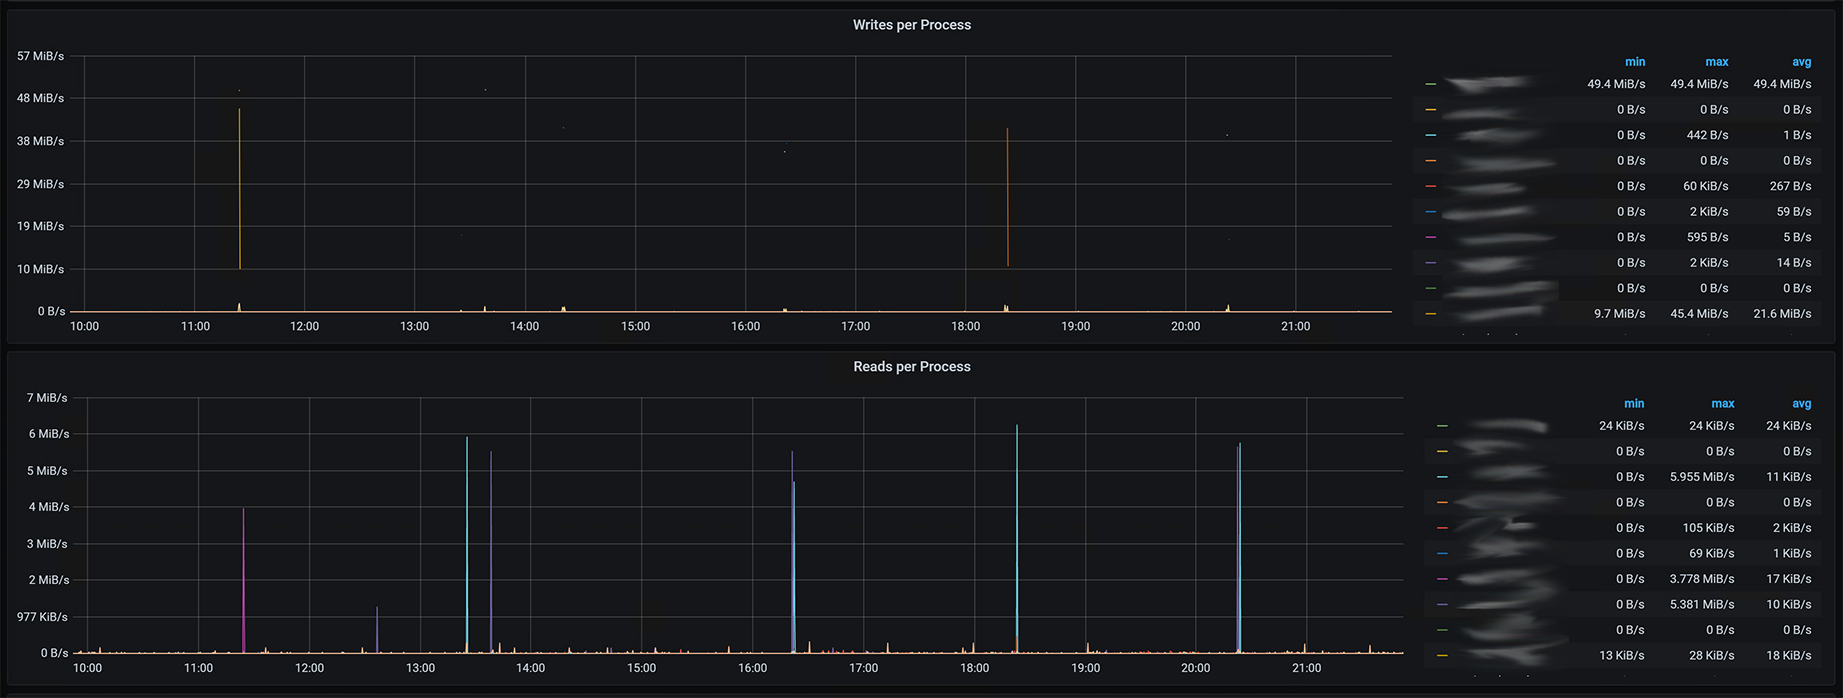
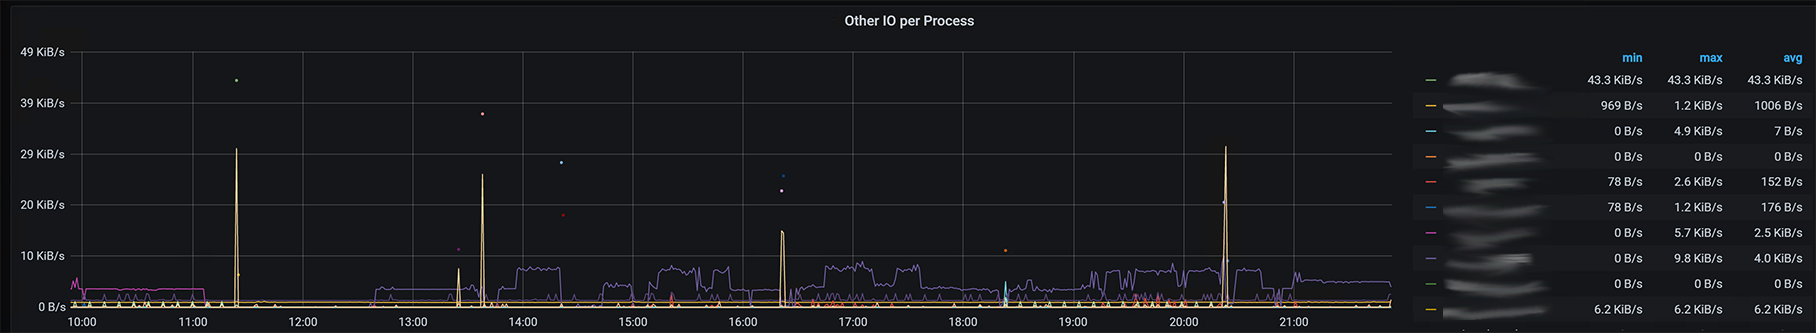
Screenshots

Used Metrics 1212
display_name
windows_cs_logical_processors
windows_process_cpu_time_total
windows_process_handle_count
windows_process_io_bytes_total
windows_process_page_file_bytes
windows_process_private_bytes
windows_process_thread_count
windows_process_virtual_bytes
windows_process_working_set
windows_service_info
windows_service_state
Get Dashboard✕
Download
Copy to Clipboard