Windows Server Status Dashboard - Prometheus 29,15429,154 5.0 (1 reviews)
Description
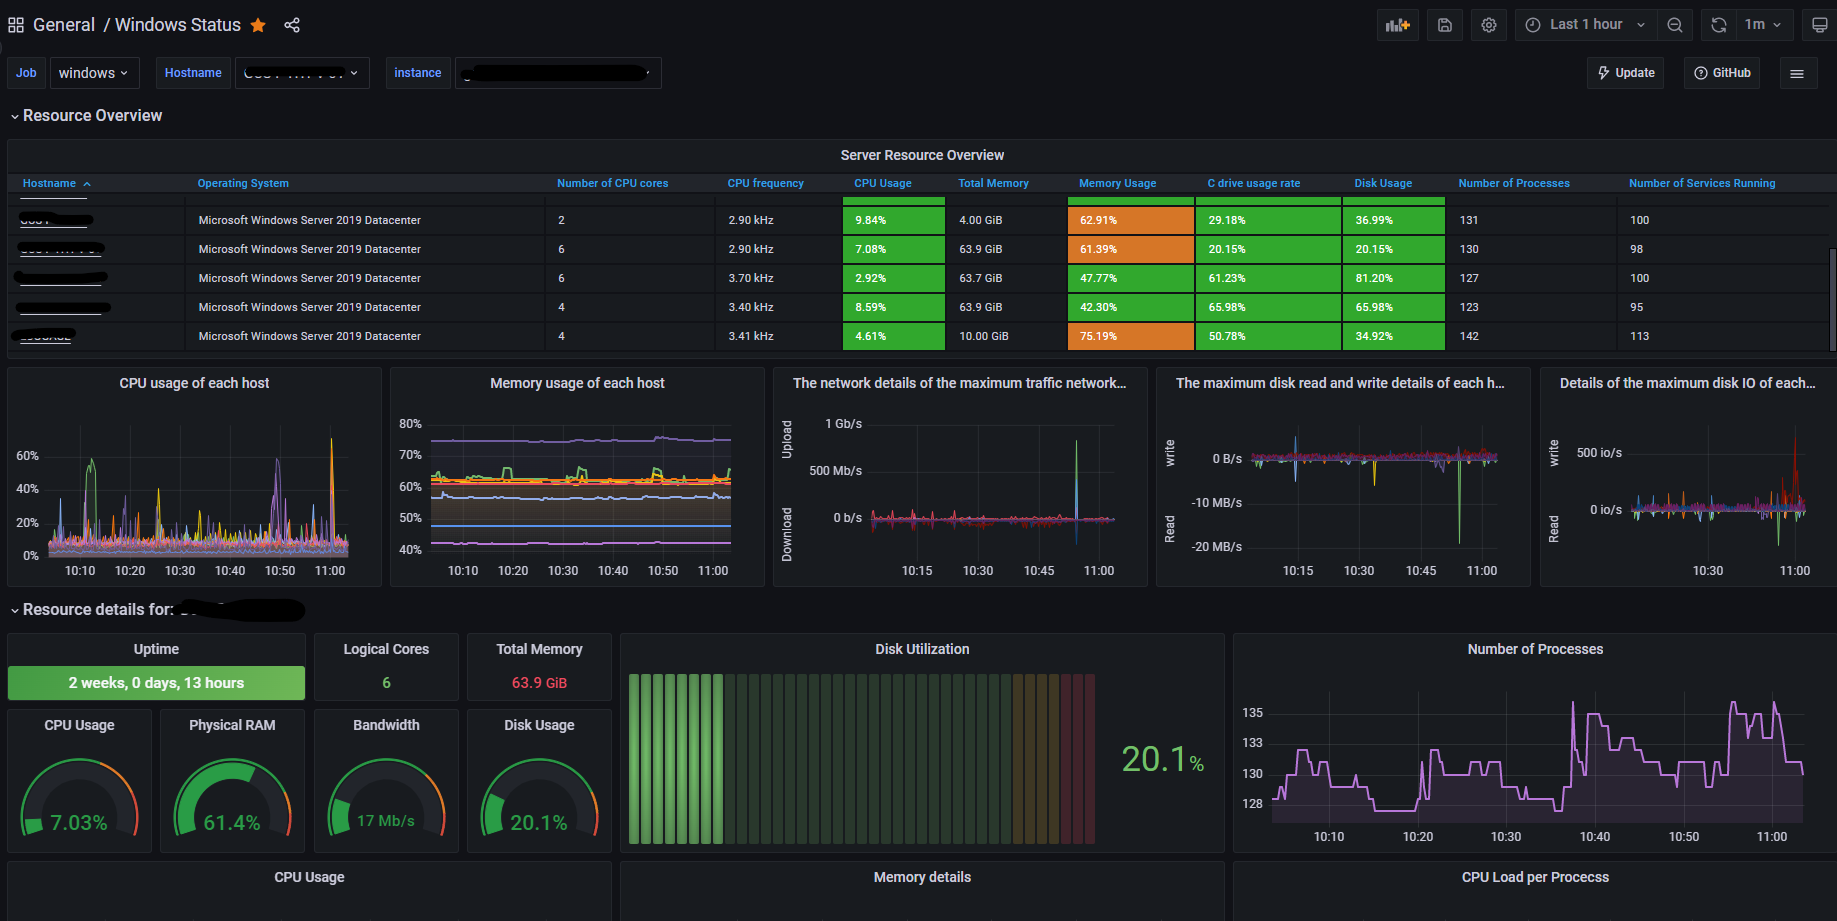
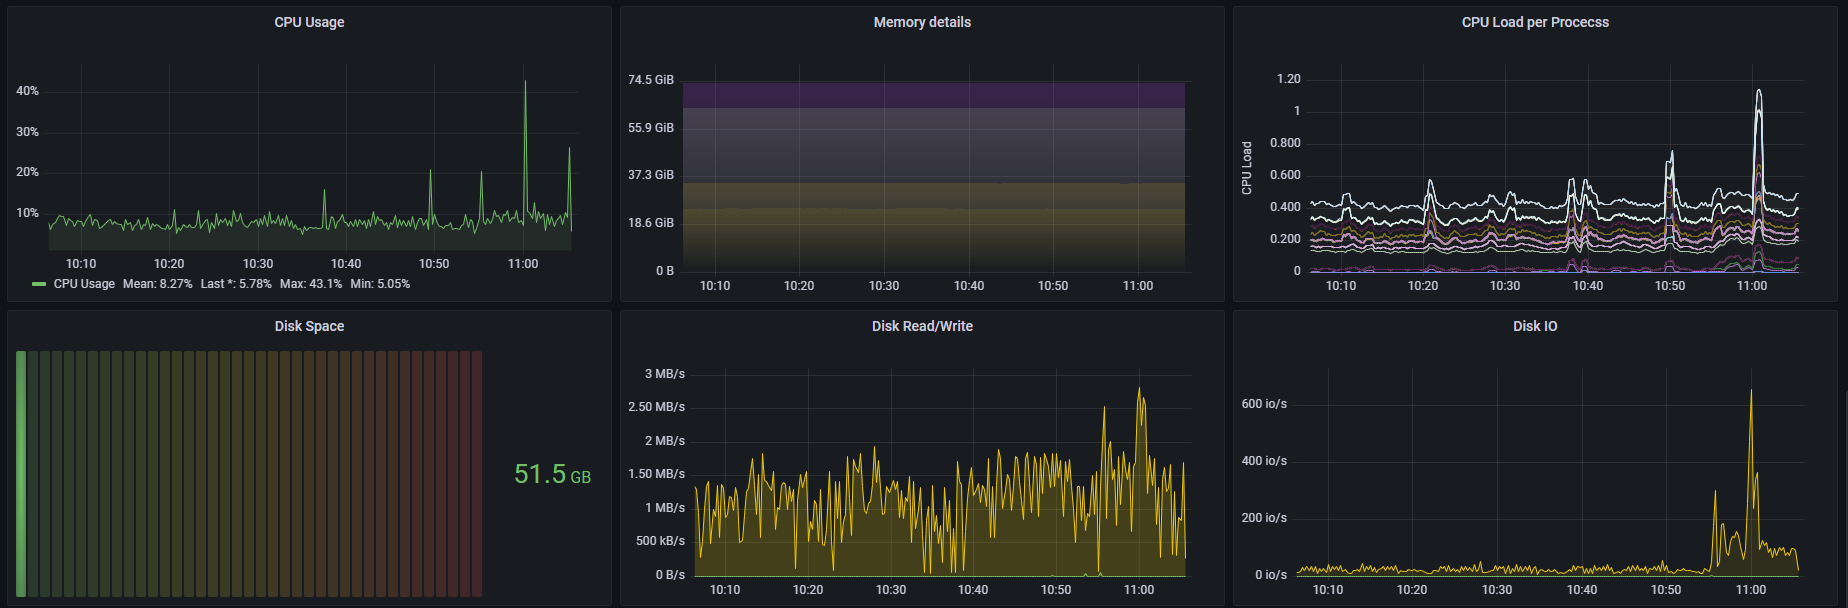
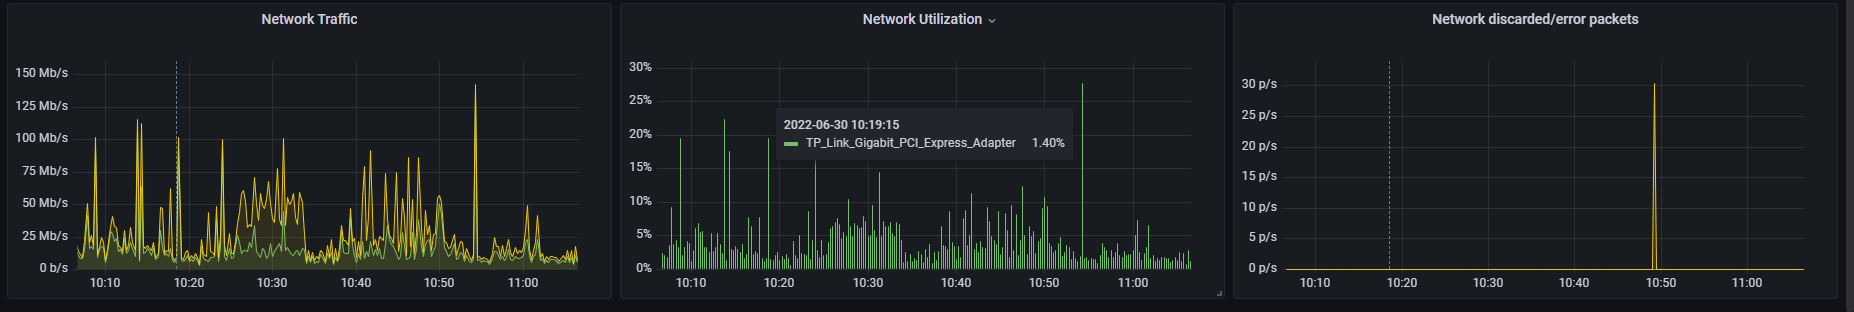
Overview Dashboard for Windows using Prometheus and Windows_Exporter
Screenshots
Used Metrics 2828
product
windows_cpu_core_frequency_mhz
windows_cpu_time_total
windows_cs_hostname
windows_cs_logical_processors
windows_cs_physical_memory_bytes
windows_logical_disk_free_bytes
windows_logical_disk_read_bytes_total
windows_logical_disk_reads_total
windows_logical_disk_size_bytes
windows_logical_disk_write_bytes_total
windows_logical_disk_writes_total
windows_net_bytes_received_total
windows_net_bytes_sent_total
windows_net_bytes_total
windows_net_current_bandwidth_bytes
windows_net_packets_outbound_discarded_total
windows_net_packets_outbound_errors_total
windows_net_packets_received_discarded_total
windows_net_packets_received_errors_total
windows_os_info
windows_os_physical_memory_free_bytes
windows_os_virtual_memory_bytes
windows_os_virtual_memory_free_bytes
windows_process_cpu_time_total
windows_service_state
windows_system_boot_time_timestamp
windows_system_processes