Windows Node Exporter 2,0062,006
1/26/2022
1/26/2022
3
>=8.2.4
Prometheus
Description
Use for analysis data that use for server performance testing
Screenshots
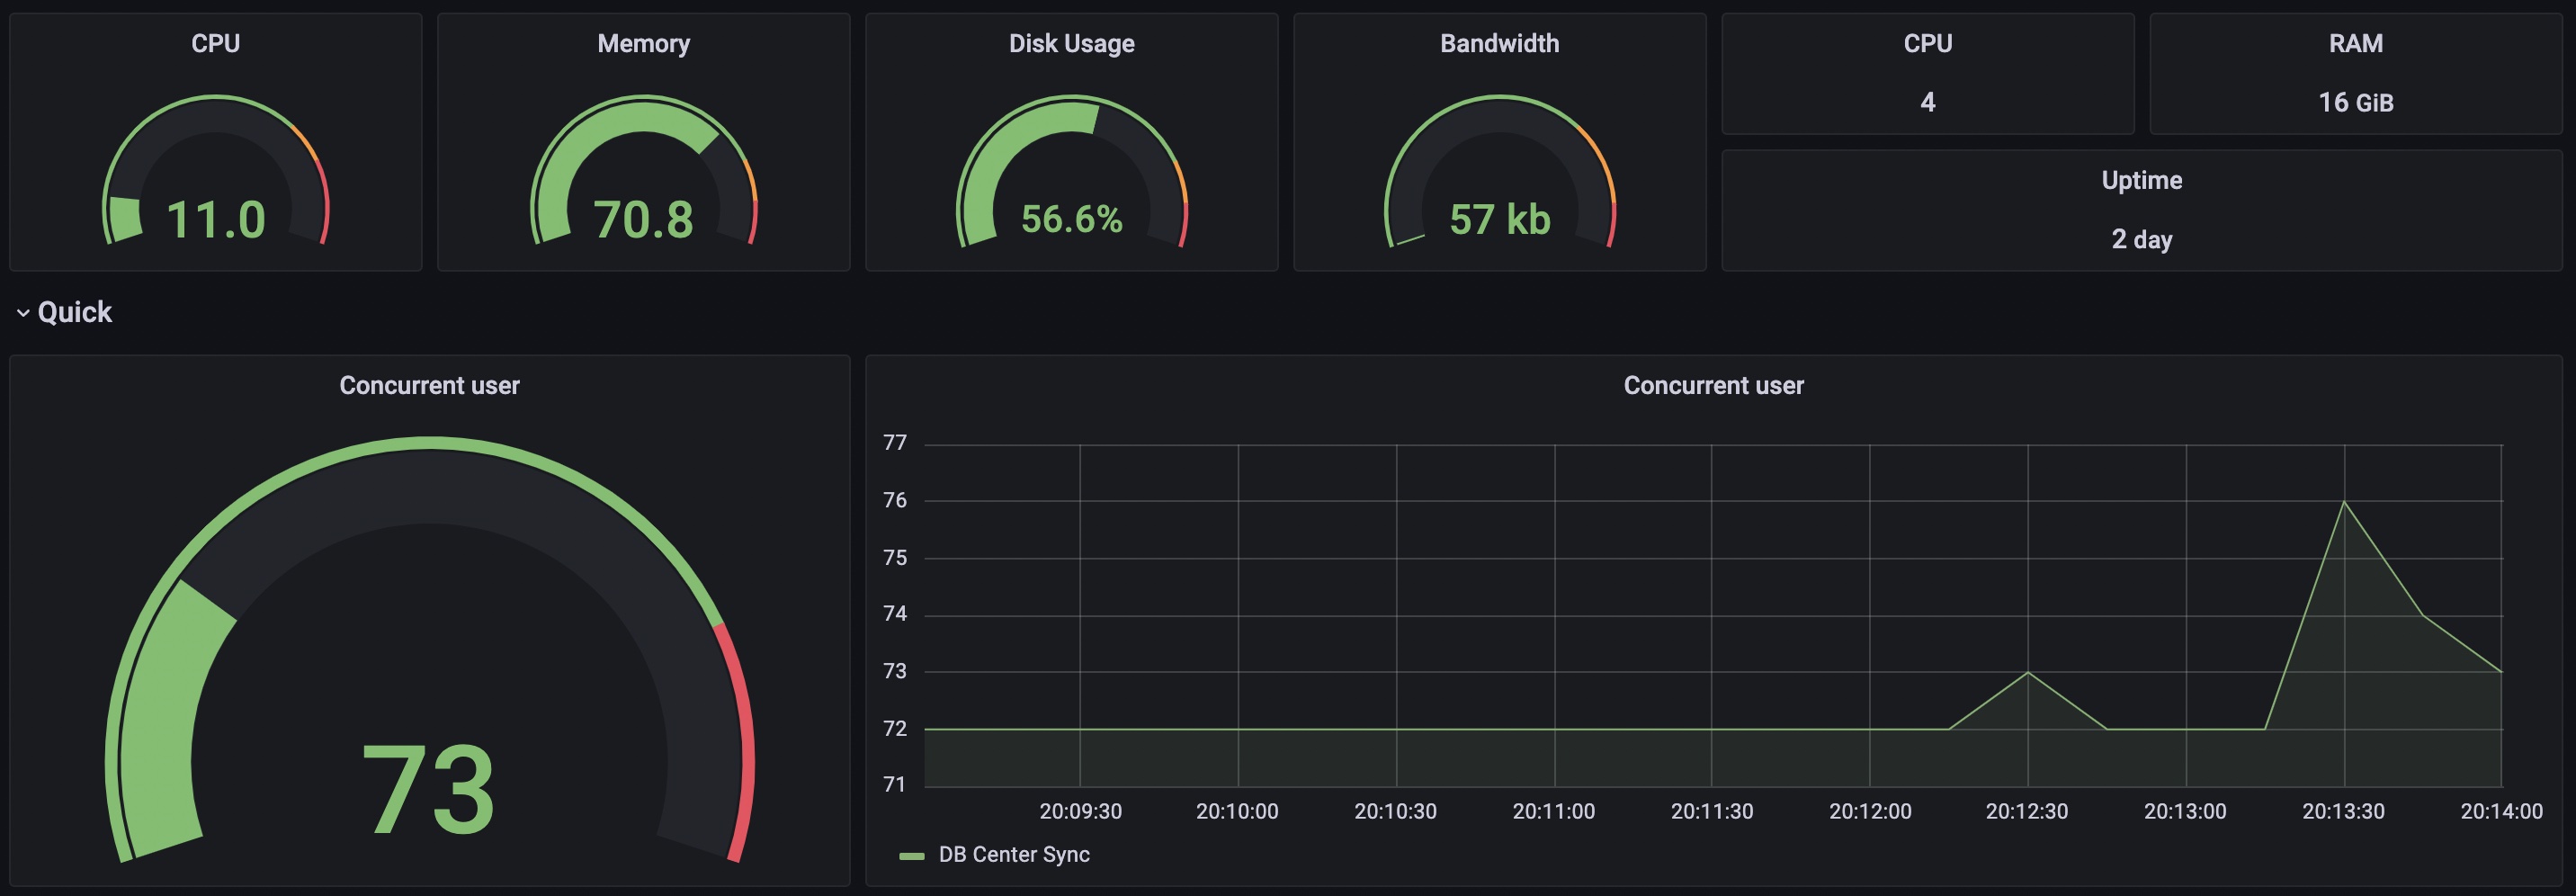
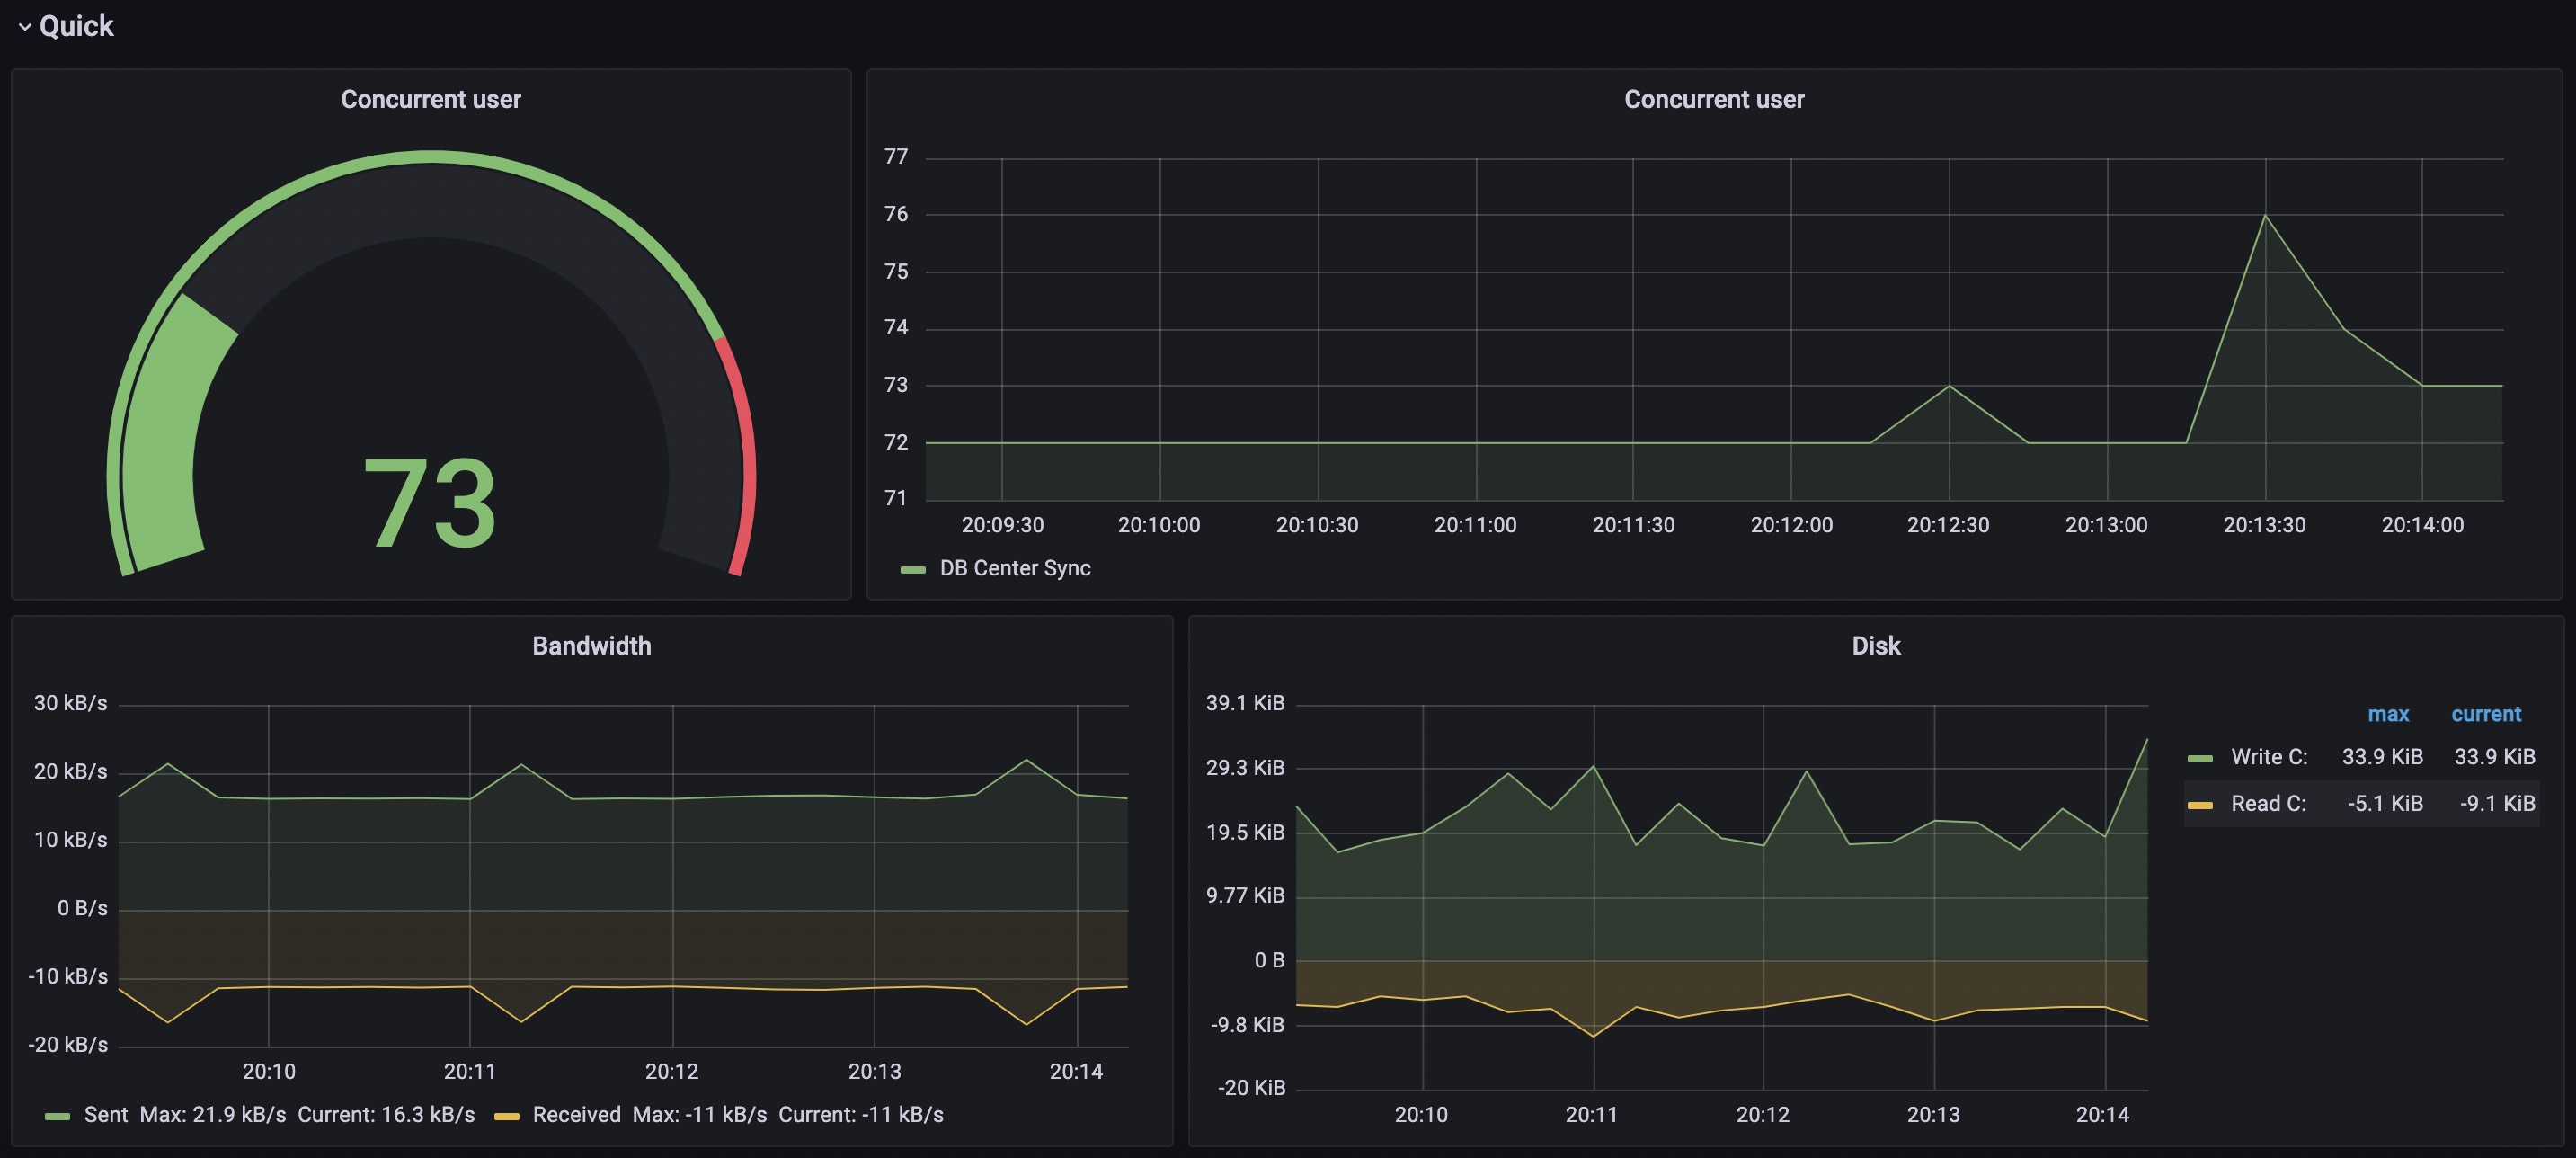
Used Metrics 1414
windows_cpu_time_total
windows_cs_logical_processors
windows_cs_physical_memory_bytes
windows_logical_disk_free_bytes
windows_logical_disk_read_bytes_total
windows_logical_disk_size_bytes
windows_logical_disk_write_bytes_total
windows_net_bytes_received_total
windows_net_bytes_sent_total
windows_net_bytes_total
windows_os_physical_memory_free_bytes
windows_os_time
windows_process_start_time
windows_tcp_connections_established
Get Dashboard✕
Download
Copy to Clipboard