Windows Node 6,6686,668 4.0 (1 reviews)
Description
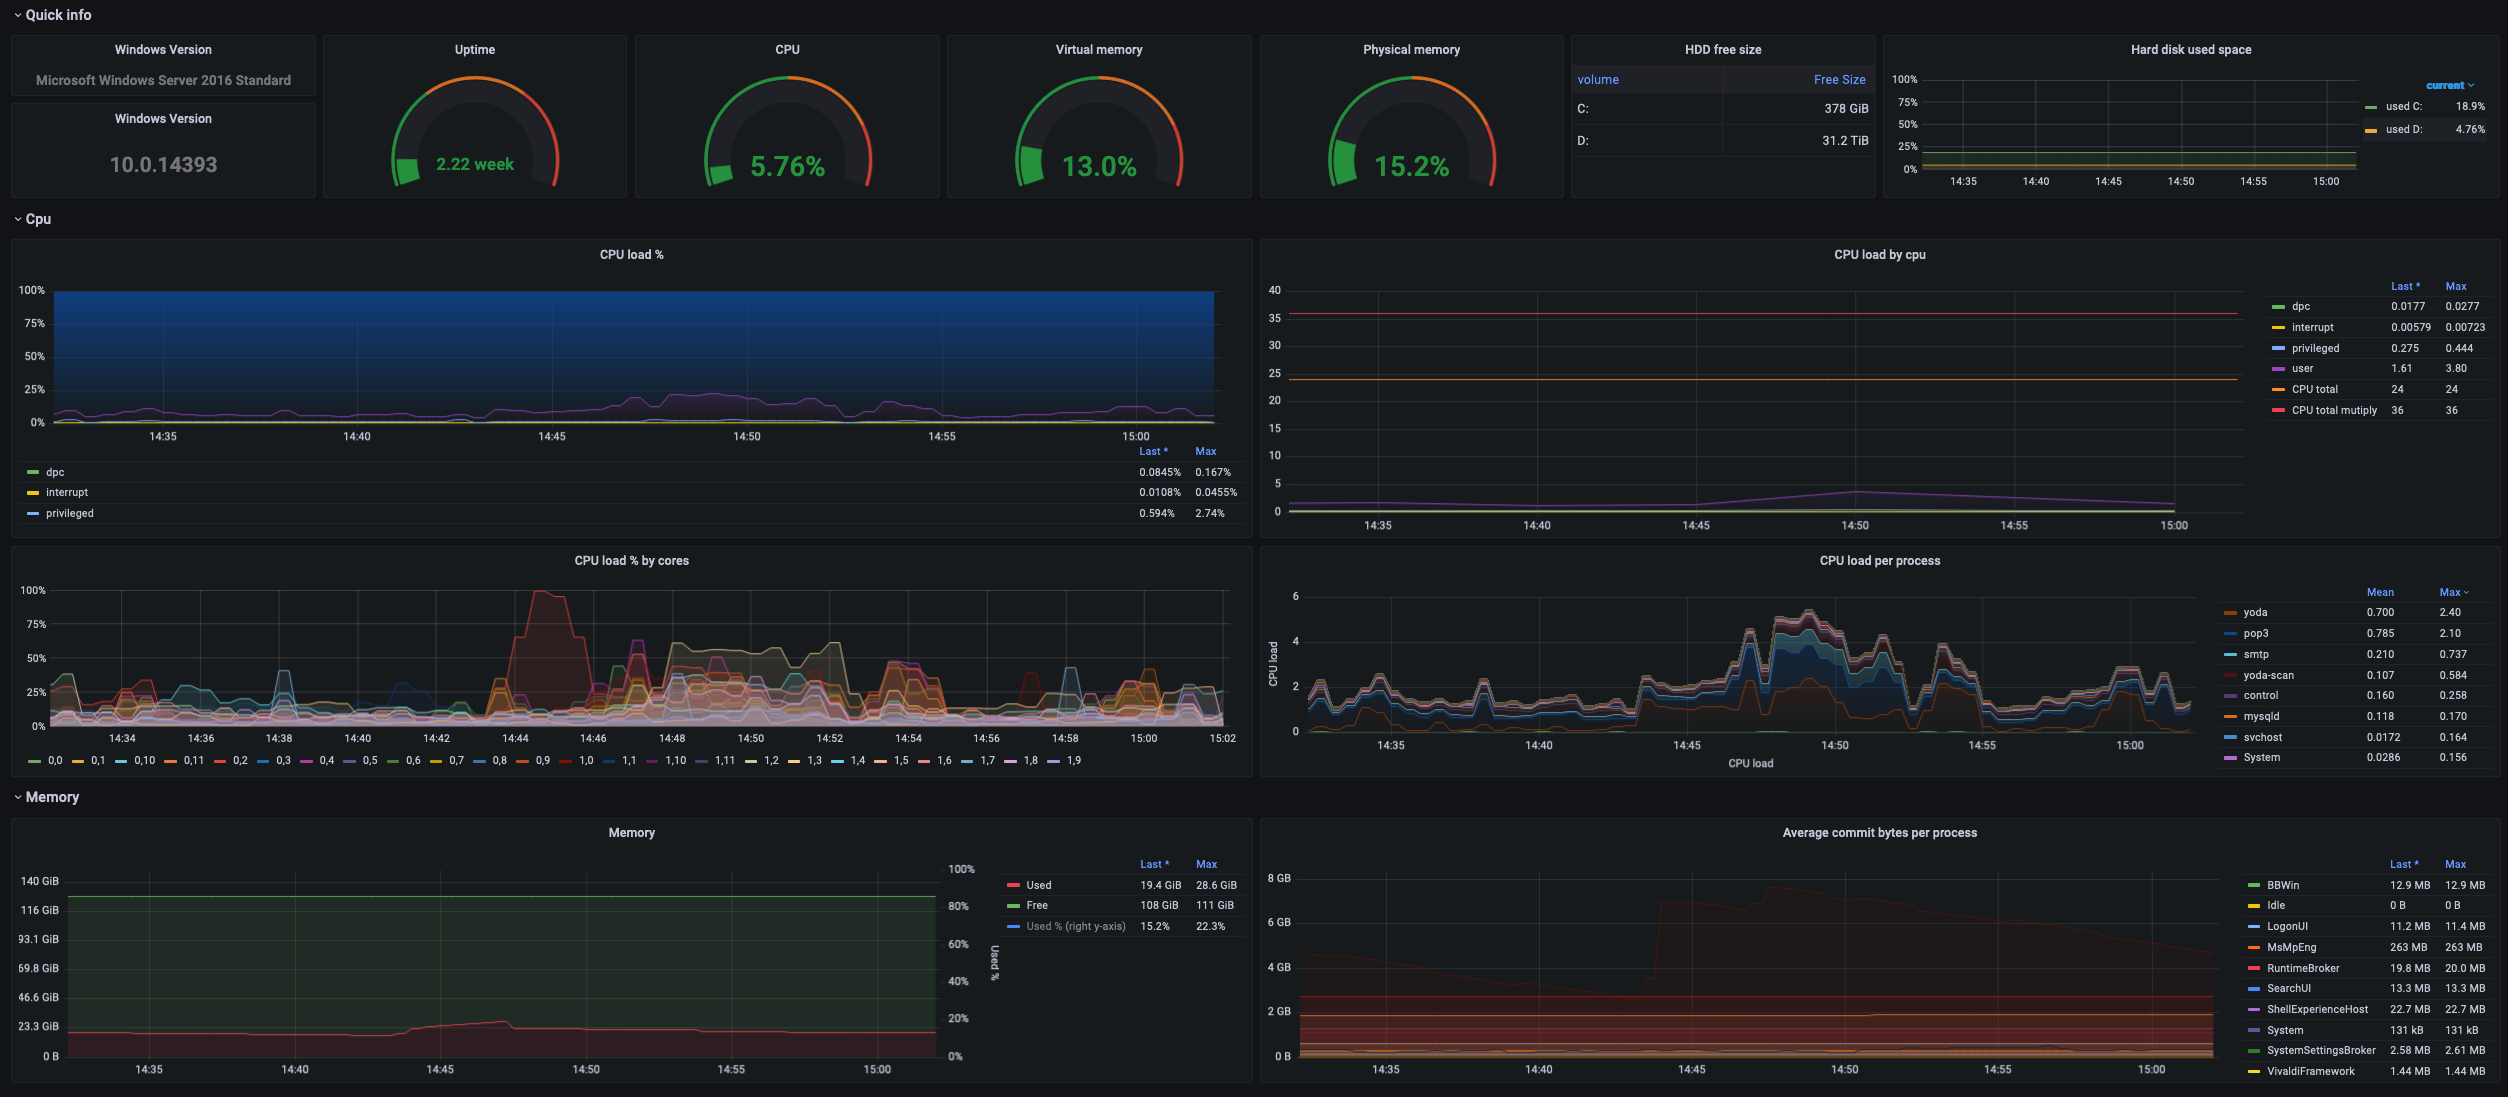
General stats dashboard with node selector, uses metrics from wmi_exporter
Screenshots
Used Metrics 3232
windows_cpu_time_total
windows_cs_physical_memory_bytes
windows_iis_current_application_pool_state
windows_iis_current_connections
windows_logical_disk_free_bytes
windows_logical_disk_read_bytes_total
windows_logical_disk_size_bytes
windows_logical_disk_split_ios_total
windows_logical_disk_write_bytes_total
windows_logical_disk_write_latency_seconds_total
windows_net_bytes_received_total
windows_net_bytes_sent_total
windows_net_bytes_total
windows_net_current_bandwidth_bytes
windows_net_packets_outbound_discarded_total
windows_net_packets_outbound_errors_total
windows_net_packets_received_discarded_total
windows_net_packets_received_errors_total
windows_net_packets_received_total
windows_net_packets_sent_total
windows_os_info
windows_os_physical_memory_free_bytes
windows_os_users
windows_os_virtual_memory_bytes
windows_os_virtual_memory_free_bytes
windows_process_cpu_time_total
windows_process_io_bytes_total
windows_process_private_bytes
windows_service_state
windows_system_exception_dispatches_total
windows_system_system_up_time
windows_system_threads