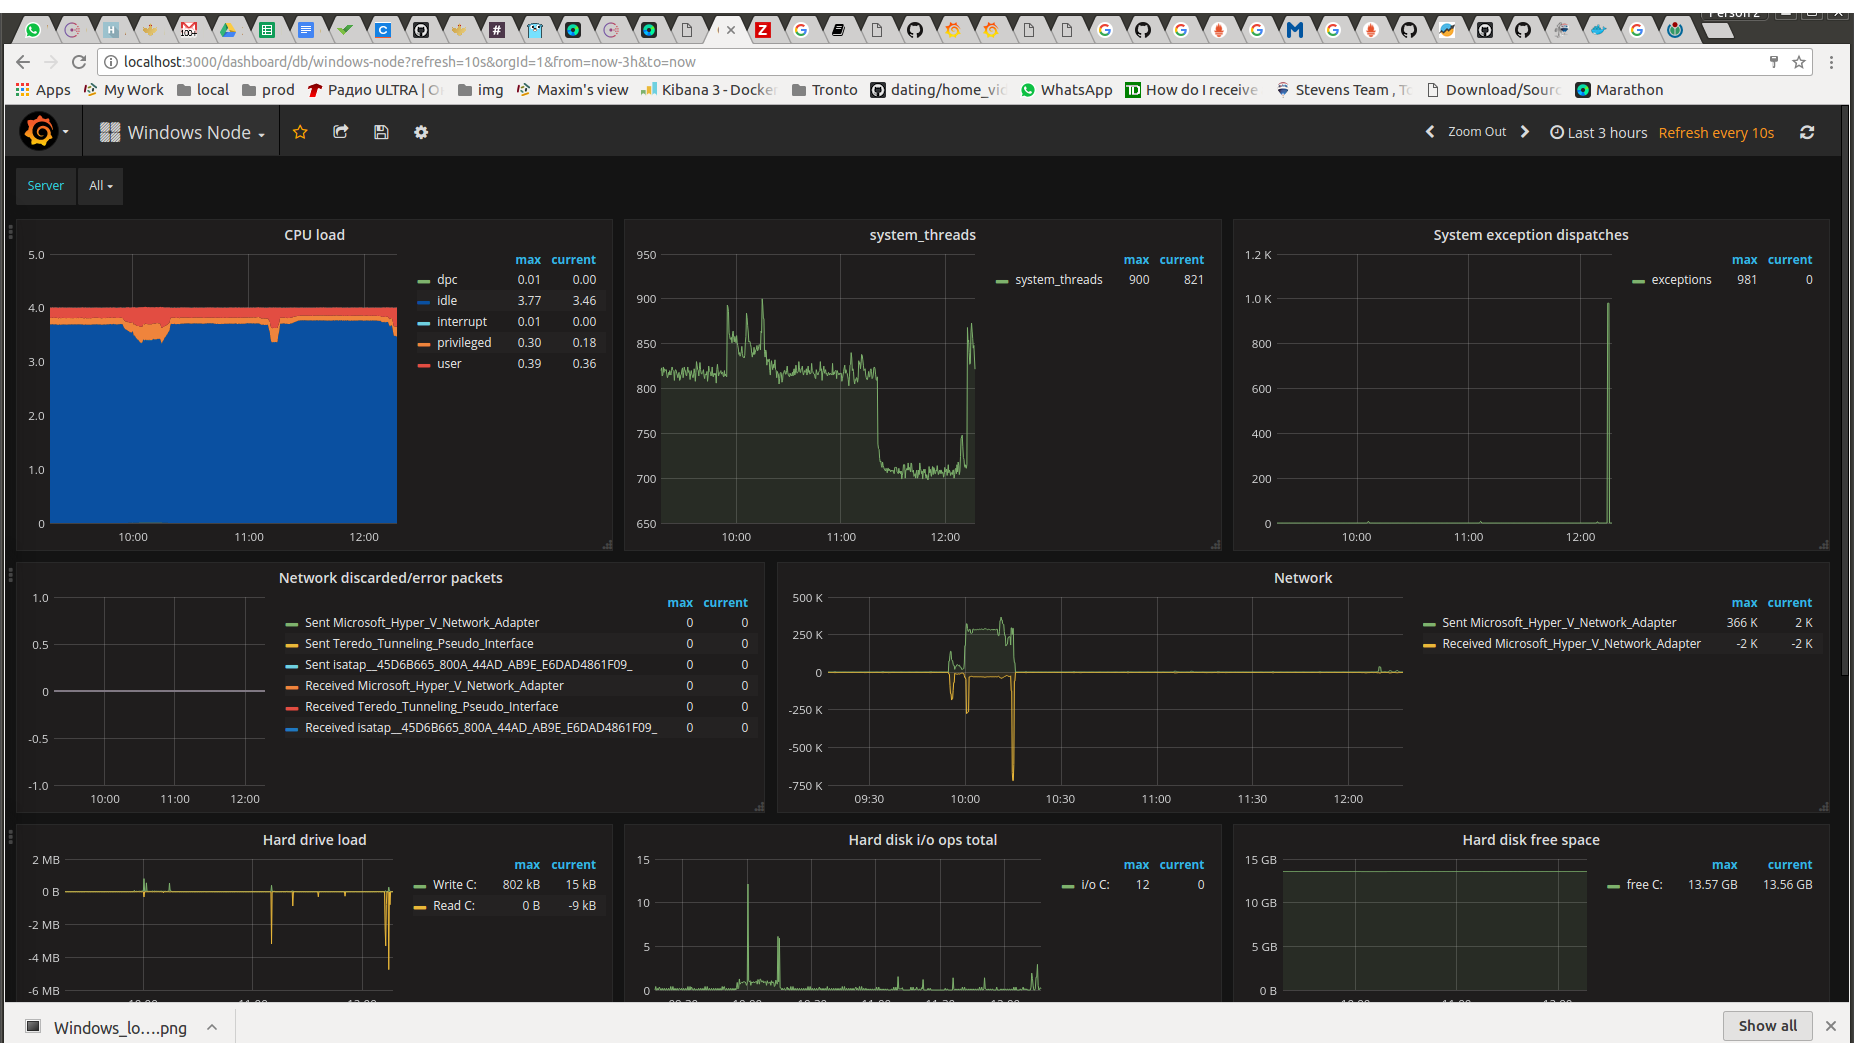
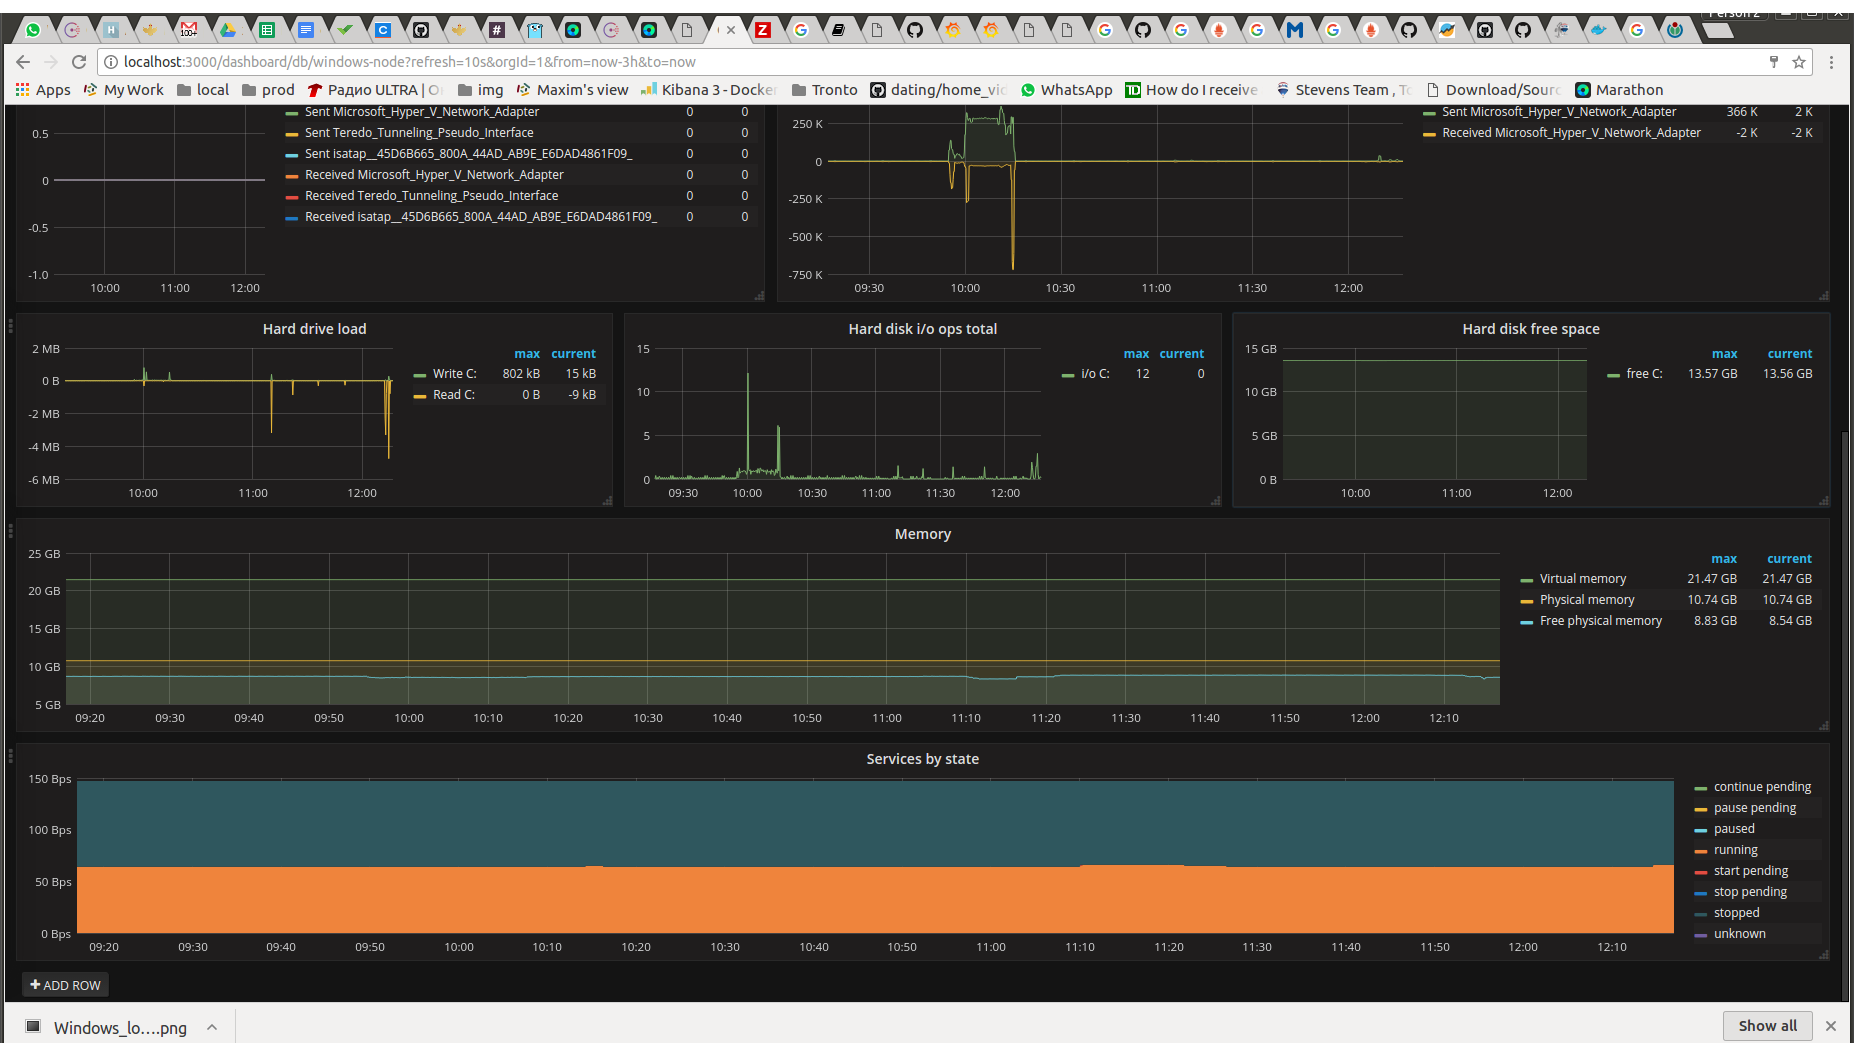
Windows Node
18,752 3.8 (8 reviews)

Created 4/28/2017
Updated 4/28/2017
Revision 3
Categories
Host Metrics
Grafana Version >=4.2.0
Datasources
Prometheus

Uses metrics from https://github.com/martinlindhe/wmi_exporter

Features:

  • Node selector
  • Summary CPU load
  • Memory stats
  • Network load
  • Hard disks usage
  • Service state summary

Prometheus config:


  - job_name: 'win-exporter'
    static_configs:
      - targets: ['192.168.0.1:9182']

192.168.0.1 - Windows node where wmi_exporter is installed

Use ['192.168.0.1:9182', '192.168.0.2:9182'] for multiple hosts

Get Dashboard
Download
Copy to Clipboard
Source Grafana.com