Windows Host Metrics | Base 6,2346,234 2.8 (4 reviews)
5/9/2019
6/3/2019
1
Host Metrics
>=6.1.6
Prometheus
Description
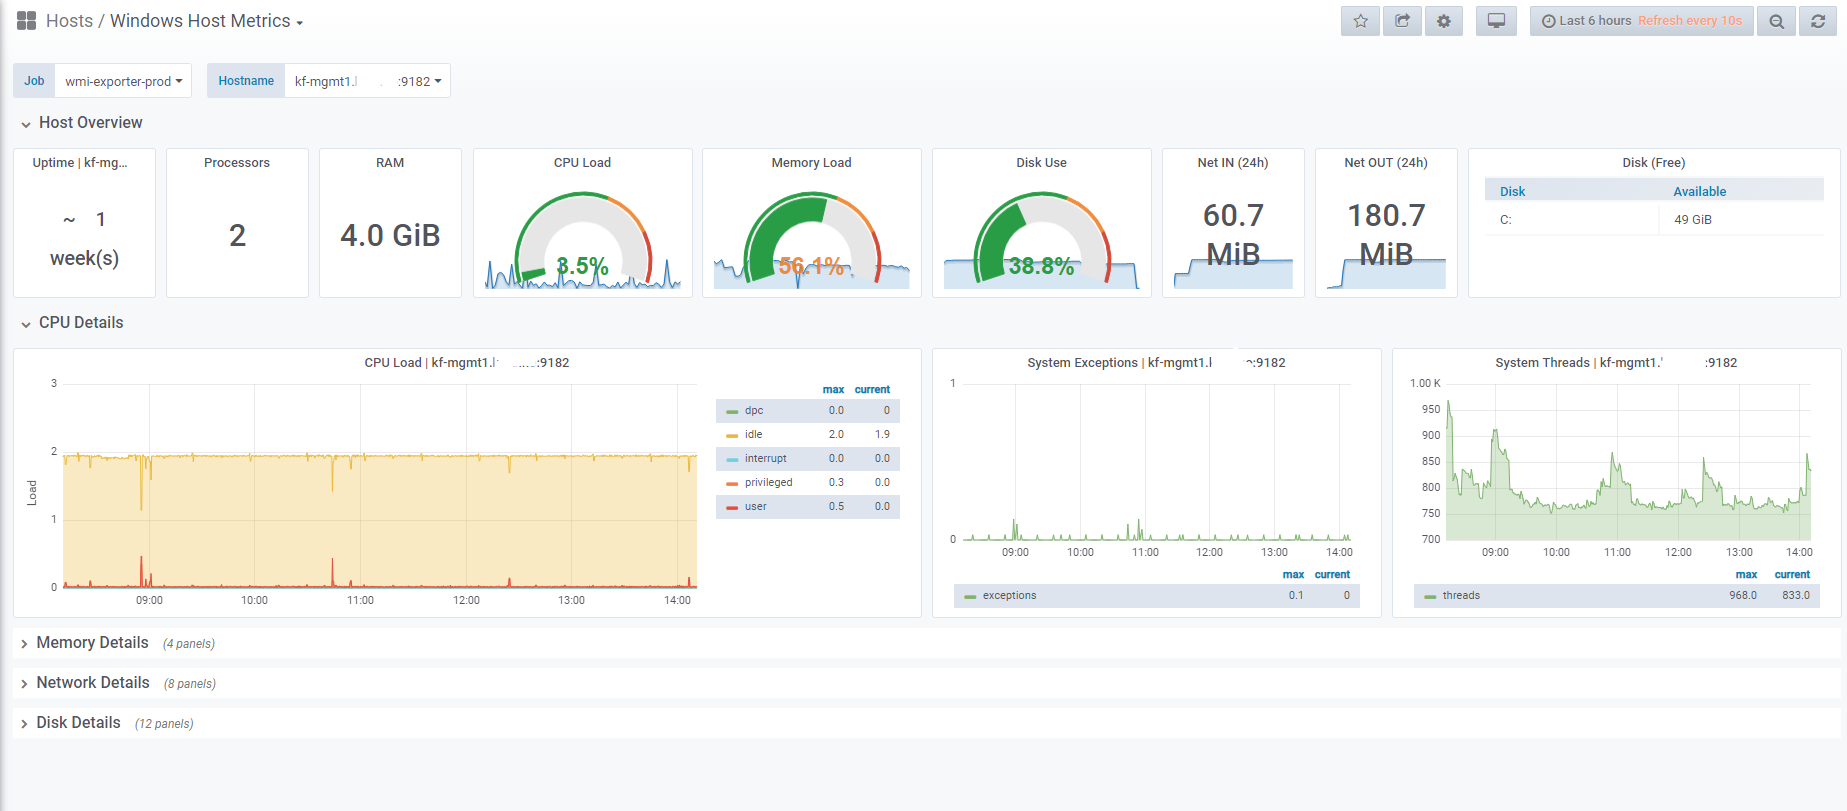
Basic overview of windows host metrics, based on WMI Exporter (v0.7.0)
Screenshots
Used Metrics 1010
wmi_cpu_time_total
wmi_cs_logical_processors
wmi_cs_physical_memory_bytes
wmi_logical_disk_free_bytes
wmi_logical_disk_size_bytes
wmi_net_bytes_received_total
wmi_net_bytes_sent_total
wmi_os_physical_memory_free_bytes
wmi_os_time
wmi_system_system_up_time
Get Dashboard✕
Download
Copy to Clipboard