windows_exporter for Prometheus Dashboard EN v20231002-SeiyaGame 1,3931,393
Description
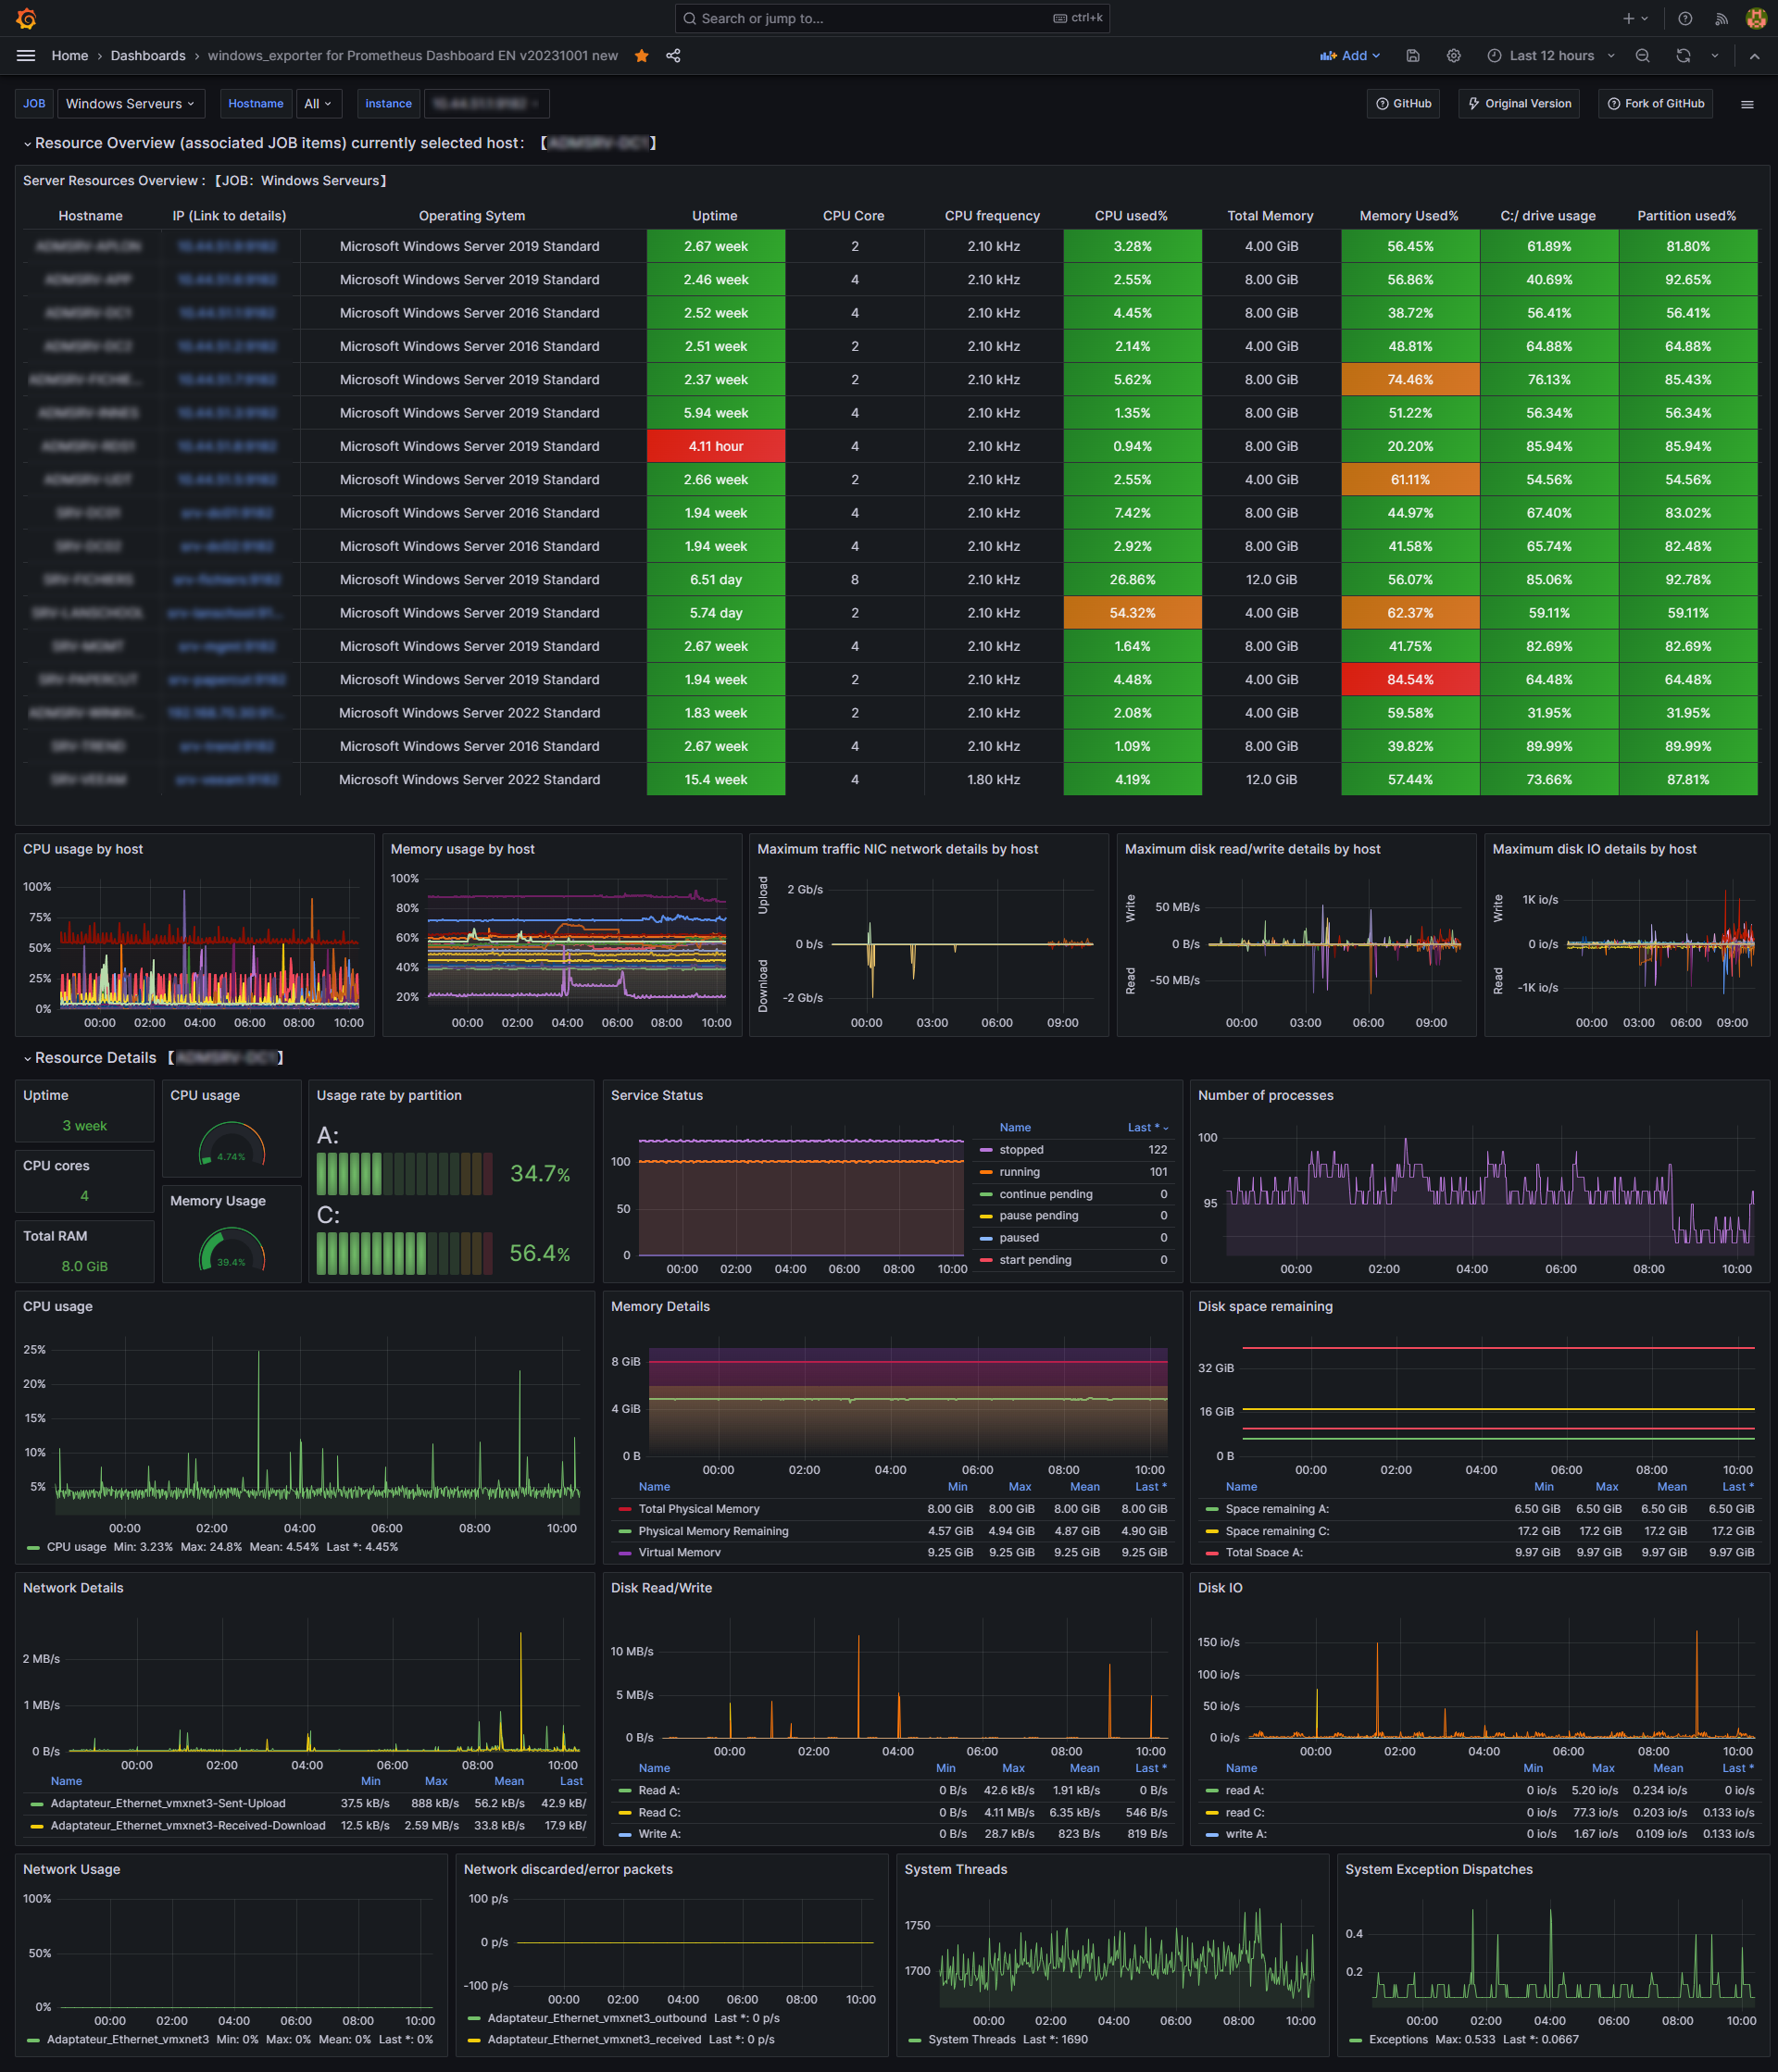
【English version】Update 2023.10.02, Includes: CPU, memory, disk IO, network, temperature and other monitoring metrics https://github.com/SeiyaGame/Prometheus
Screenshots
Used Metrics 2929
product
windows_cpu_core_frequency_mhz
windows_cpu_time_total
windows_cs_hostname
windows_cs_logical_processors
windows_cs_physical_memory_bytes
windows_logical_disk_free_bytes
windows_logical_disk_read_bytes_total
windows_logical_disk_reads_total
windows_logical_disk_size_bytes
windows_logical_disk_write_bytes_total
windows_logical_disk_writes_total
windows_net_bytes_received_total
windows_net_bytes_sent_total
windows_net_bytes_total
windows_net_current_bandwidth_bytes
windows_net_packets_outbound_discarded_total
windows_net_packets_outbound_errors_total
windows_net_packets_received_discarded_total
windows_net_packets_received_errors_total
windows_os_info
windows_os_physical_memory_free_bytes
windows_os_processes
windows_os_virtual_memory_bytes
windows_os_virtual_memory_free_bytes
windows_service_state
windows_system_exception_dispatches_total
windows_system_system_up_time
windows_system_threads