Windows Exporter Dashboard 2024 42,32642,326
Description
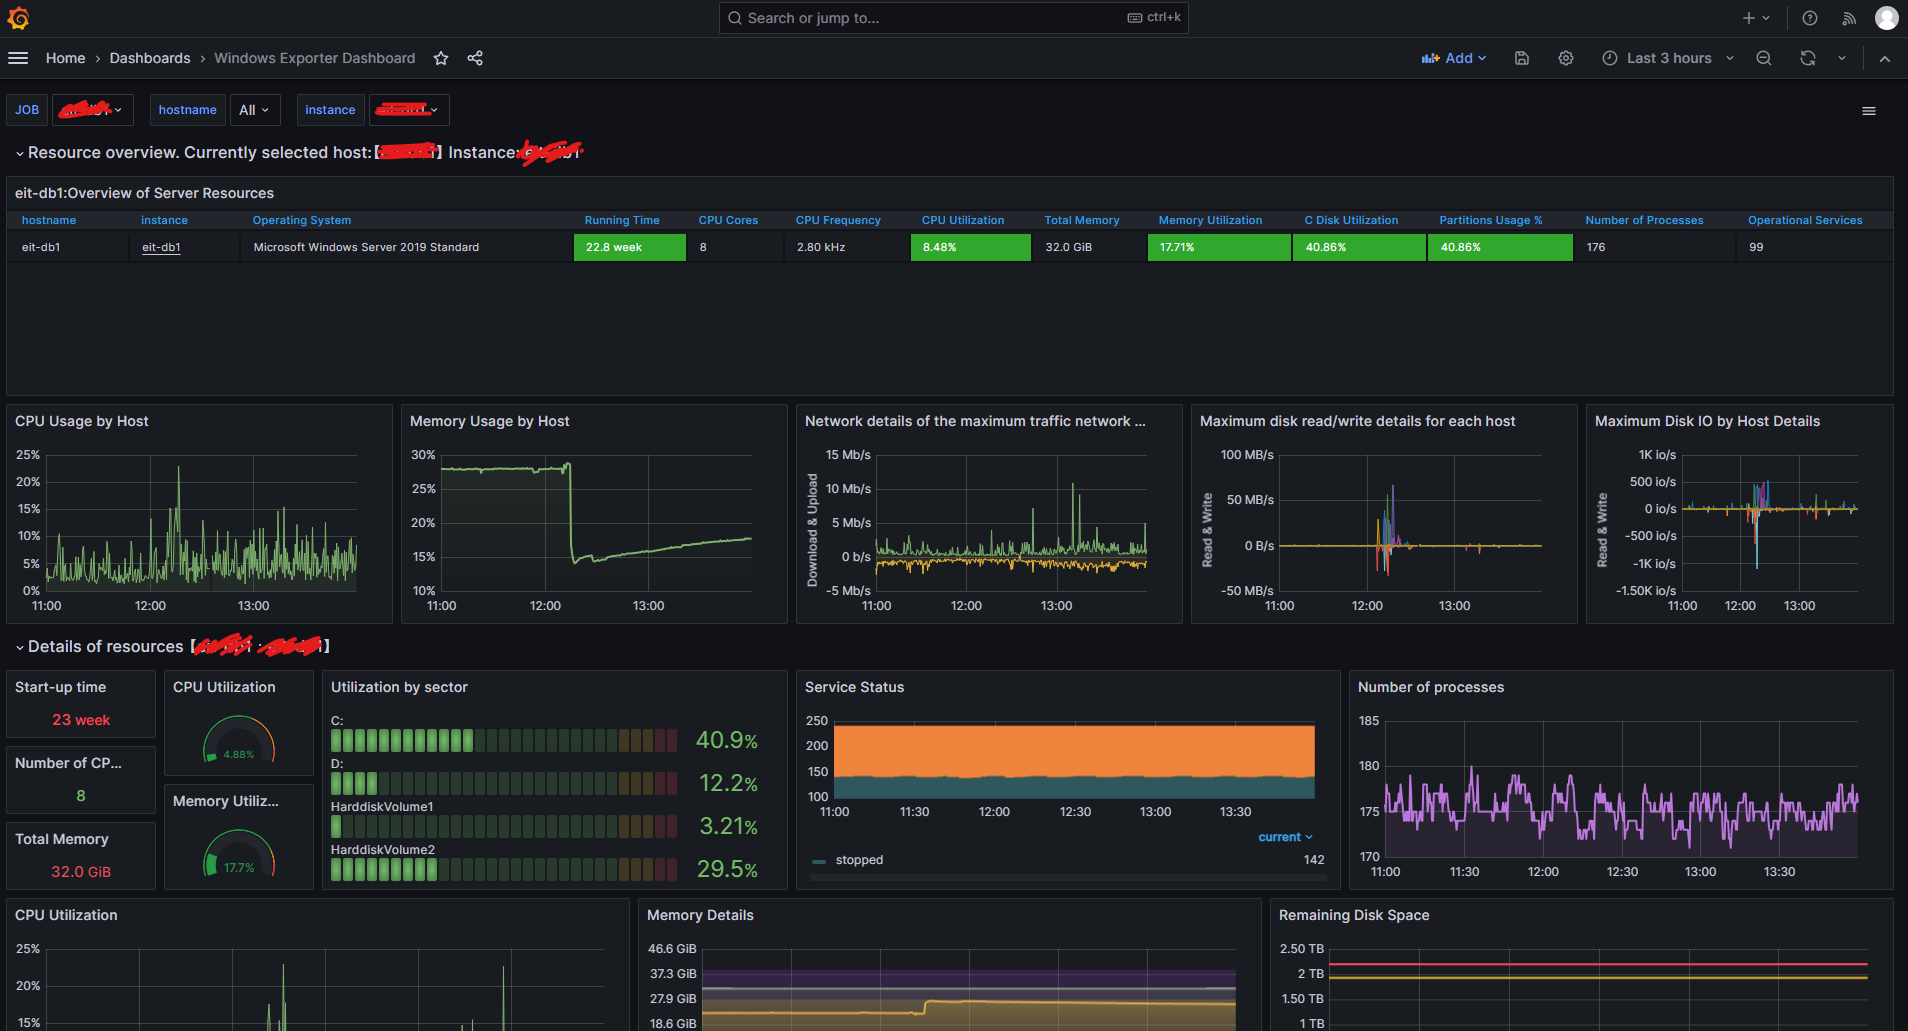
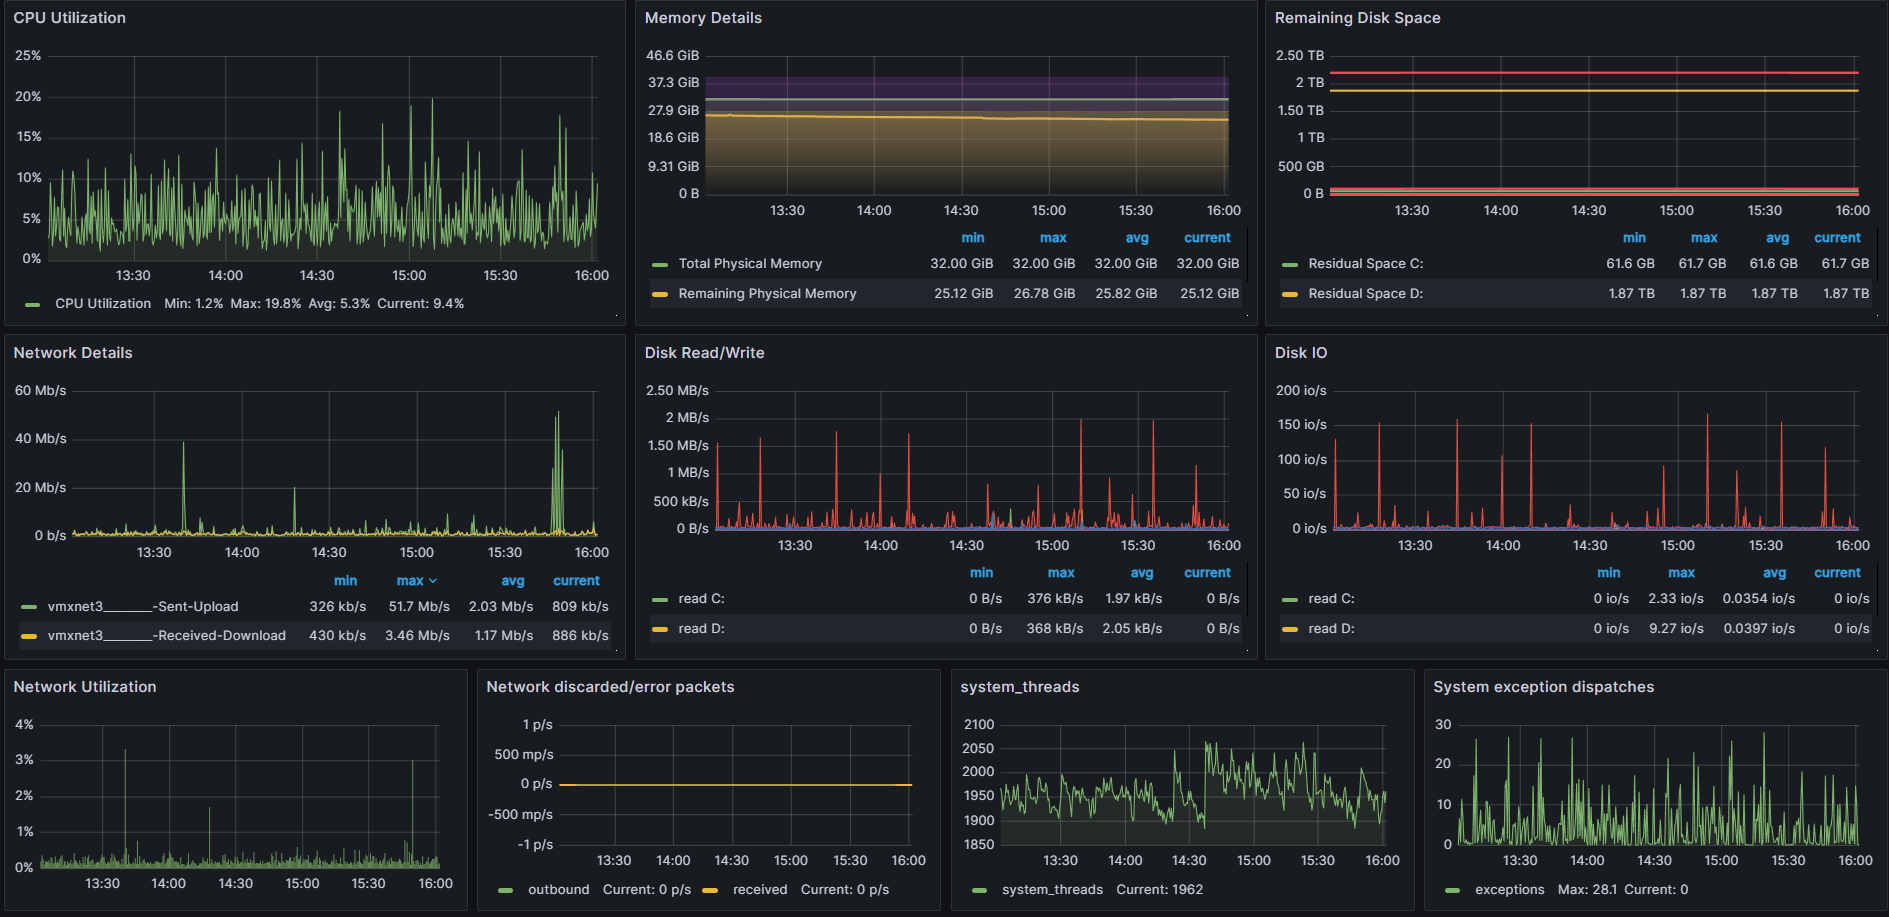
This dashboard provides a comprehensive view of Windows server health and resource utilization by aggregating host-level metrics from the Windows Exporter. It emphasizes resource utilization patterns and availability, featuring detailed panels such as windows_os_info alongside CPU, memory, disk, and network metrics to identify bottlenecks and capacity trends. Key metrics include: windows_cs_hostname and windows_system_system_up_time for host context and uptime, windows_cpu_time_total or windows_cpu_core_frequency_mhz for processor activity, and windows_cs_physical_memory_bytes and windows_os_physical_memory_free_bytes for memory balance and free vs total memory.
Screenshots
Used Metrics 2929
product
windows_cpu_core_frequency_mhz
windows_cpu_time_total
windows_cs_hostname
windows_cs_logical_processors
windows_cs_physical_memory_bytes
windows_logical_disk_free_bytes
windows_logical_disk_read_bytes_total
windows_logical_disk_reads_total
windows_logical_disk_size_bytes
windows_logical_disk_write_bytes_total
windows_logical_disk_writes_total
windows_net_bytes_received_total
windows_net_bytes_sent_total
windows_net_bytes_total
windows_net_current_bandwidth_bytes
windows_net_packets_outbound_discarded_total
windows_net_packets_outbound_errors_total
windows_net_packets_received_discarded_total
windows_net_packets_received_errors_total
windows_os_info
windows_os_physical_memory_free_bytes
windows_os_processes
windows_os_virtual_memory_bytes
windows_os_virtual_memory_free_bytes
windows_service_state
windows_system_exception_dispatches_total
windows_system_system_up_time
windows_system_threads