Windows Exporter Dashboard 20230531-StarsL.cn 21,55221,552 4.1 (8 reviews)
Description
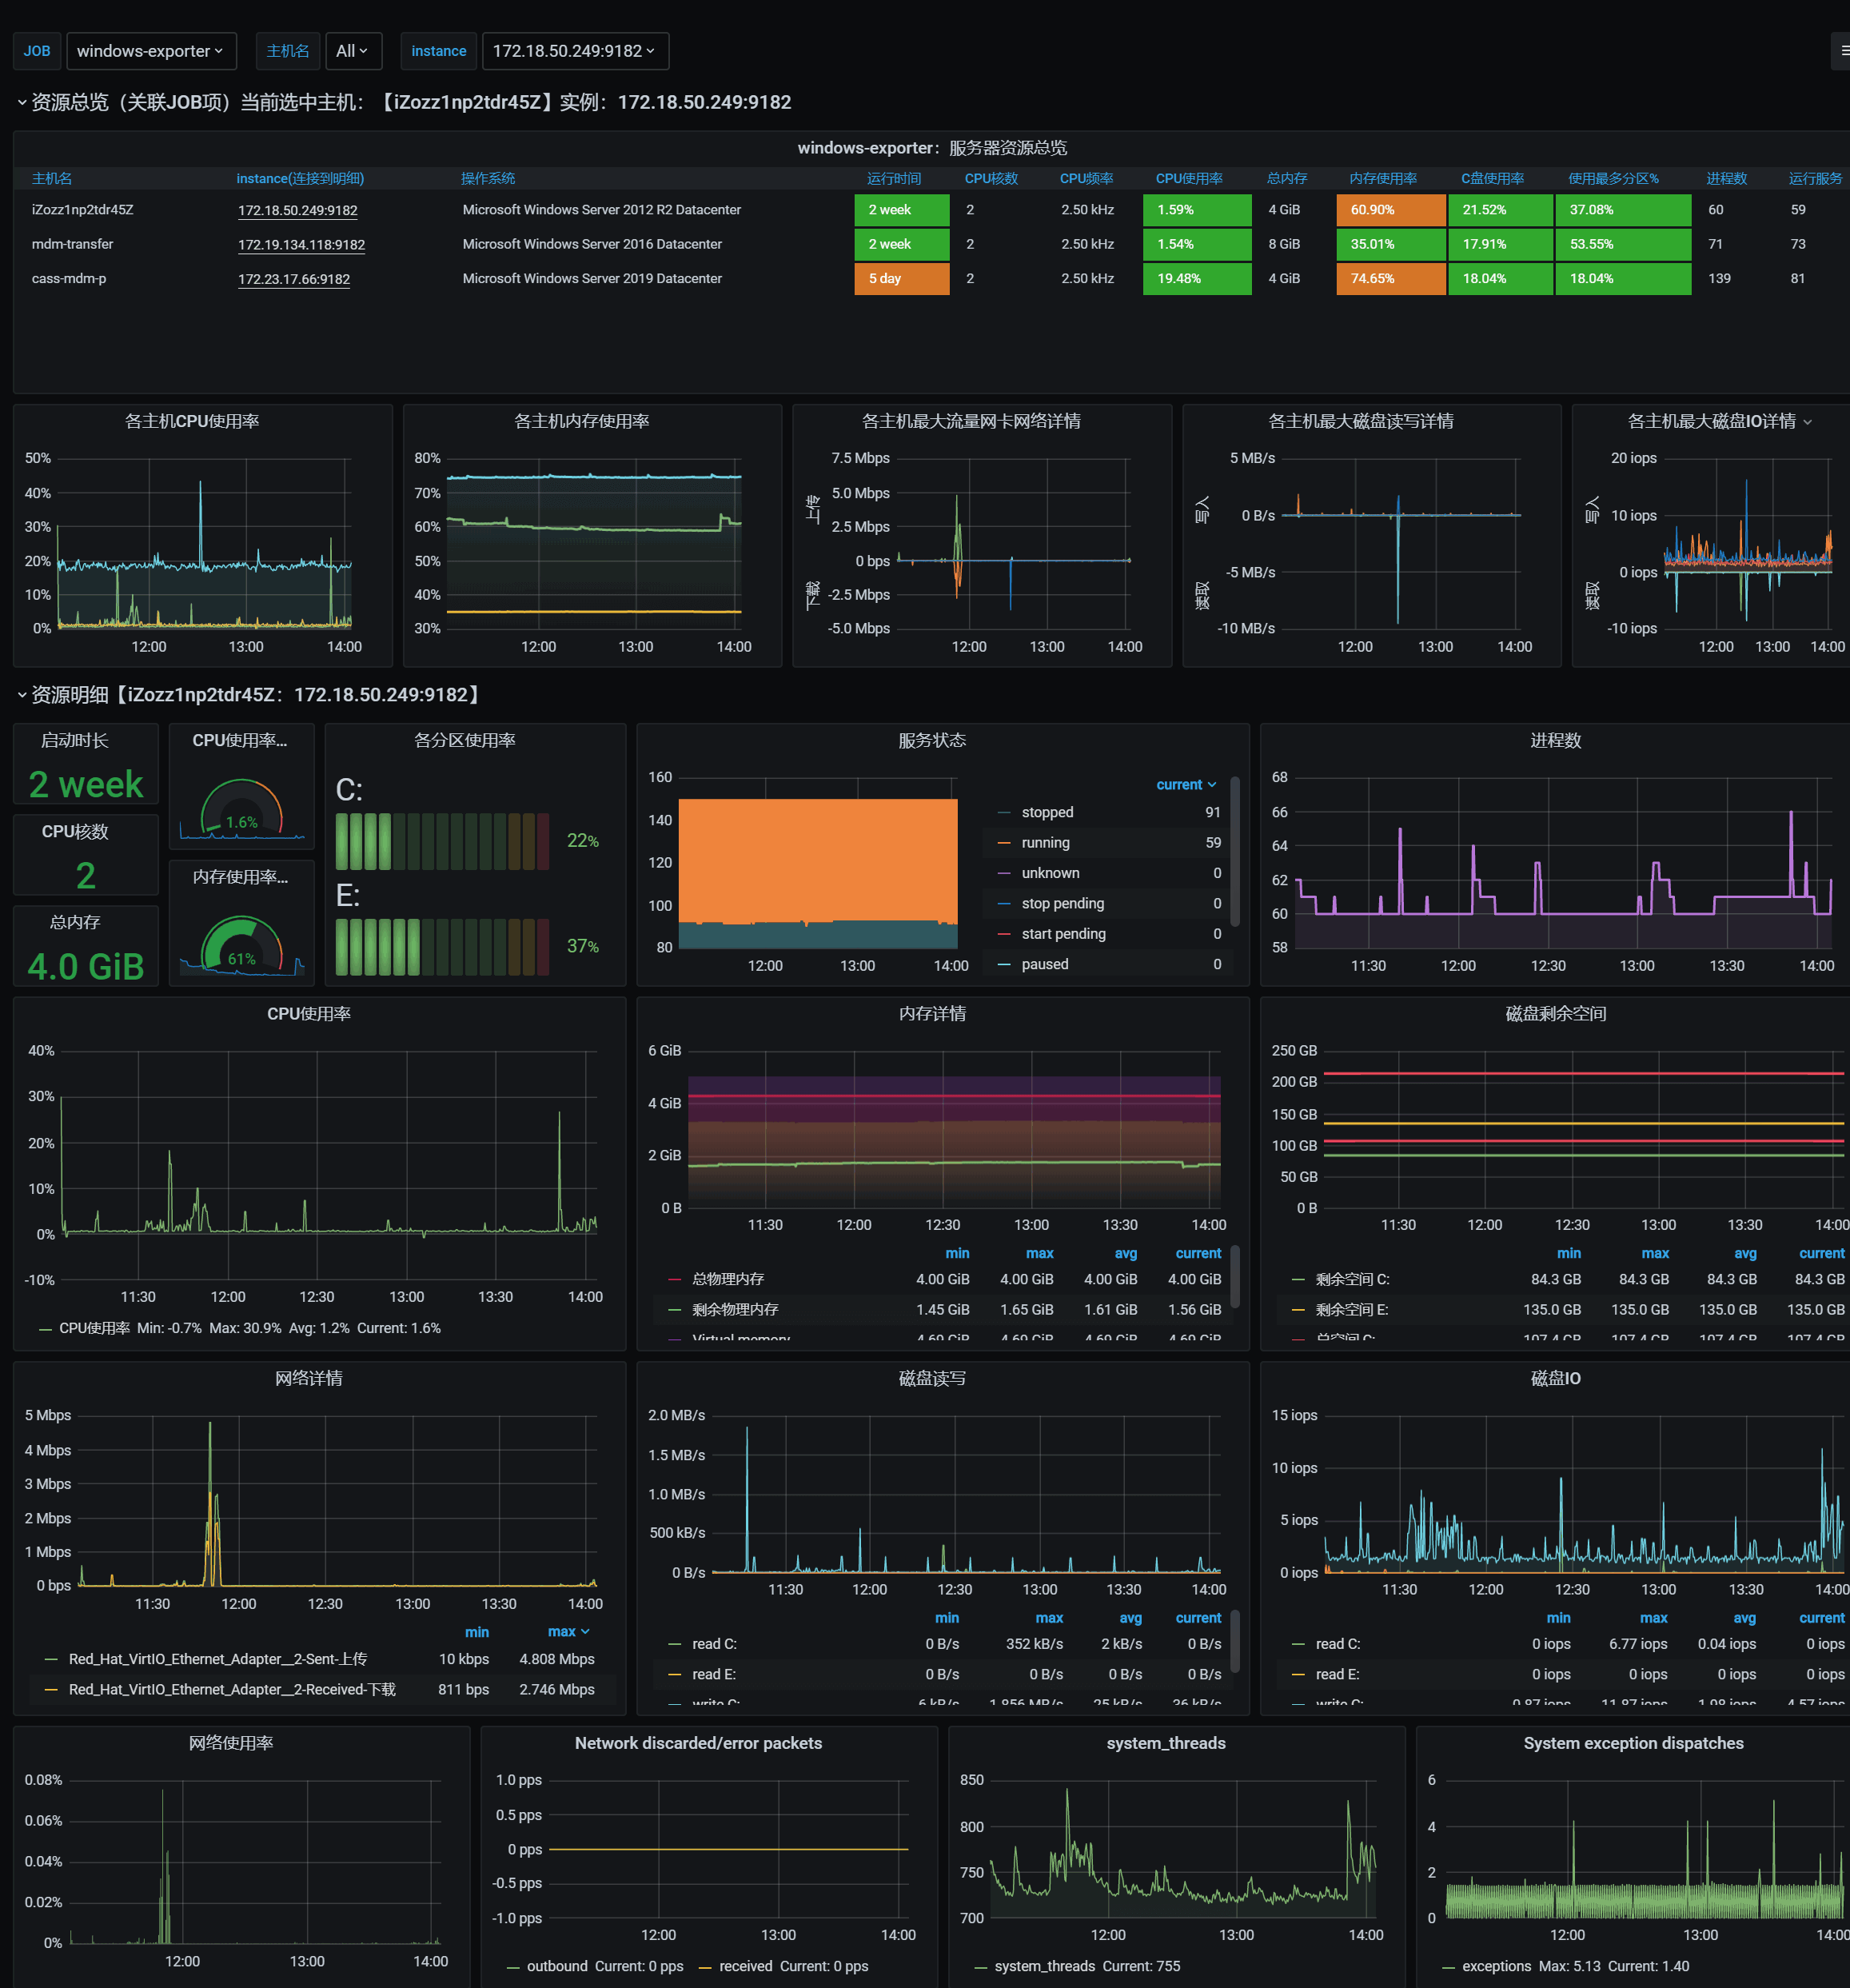
Windows的Prometheus监控看板展示,增加了资源汇总展示,优化了明细展示。更新支持windows_exporter 0.22.0。
Screenshots
Used Metrics 2929
product
windows_cpu_core_frequency_mhz
windows_cpu_time_total
windows_cs_hostname
windows_cs_logical_processors
windows_cs_physical_memory_bytes
windows_logical_disk_free_bytes
windows_logical_disk_read_bytes_total
windows_logical_disk_reads_total
windows_logical_disk_size_bytes
windows_logical_disk_write_bytes_total
windows_logical_disk_writes_total
windows_net_bytes_received_total
windows_net_bytes_sent_total
windows_net_bytes_total
windows_net_current_bandwidth_bytes
windows_net_packets_outbound_discarded_total
windows_net_packets_outbound_errors_total
windows_net_packets_received_discarded_total
windows_net_packets_received_errors_total
windows_os_info
windows_os_physical_memory_free_bytes
windows_os_processes
windows_os_virtual_memory_bytes
windows_os_virtual_memory_free_bytes
windows_service_state
windows_system_exception_dispatches_total
windows_system_system_up_time
windows_system_threads