Windows Exporter Dashboard 40,69340,693 4.0 (8 reviews)
Description
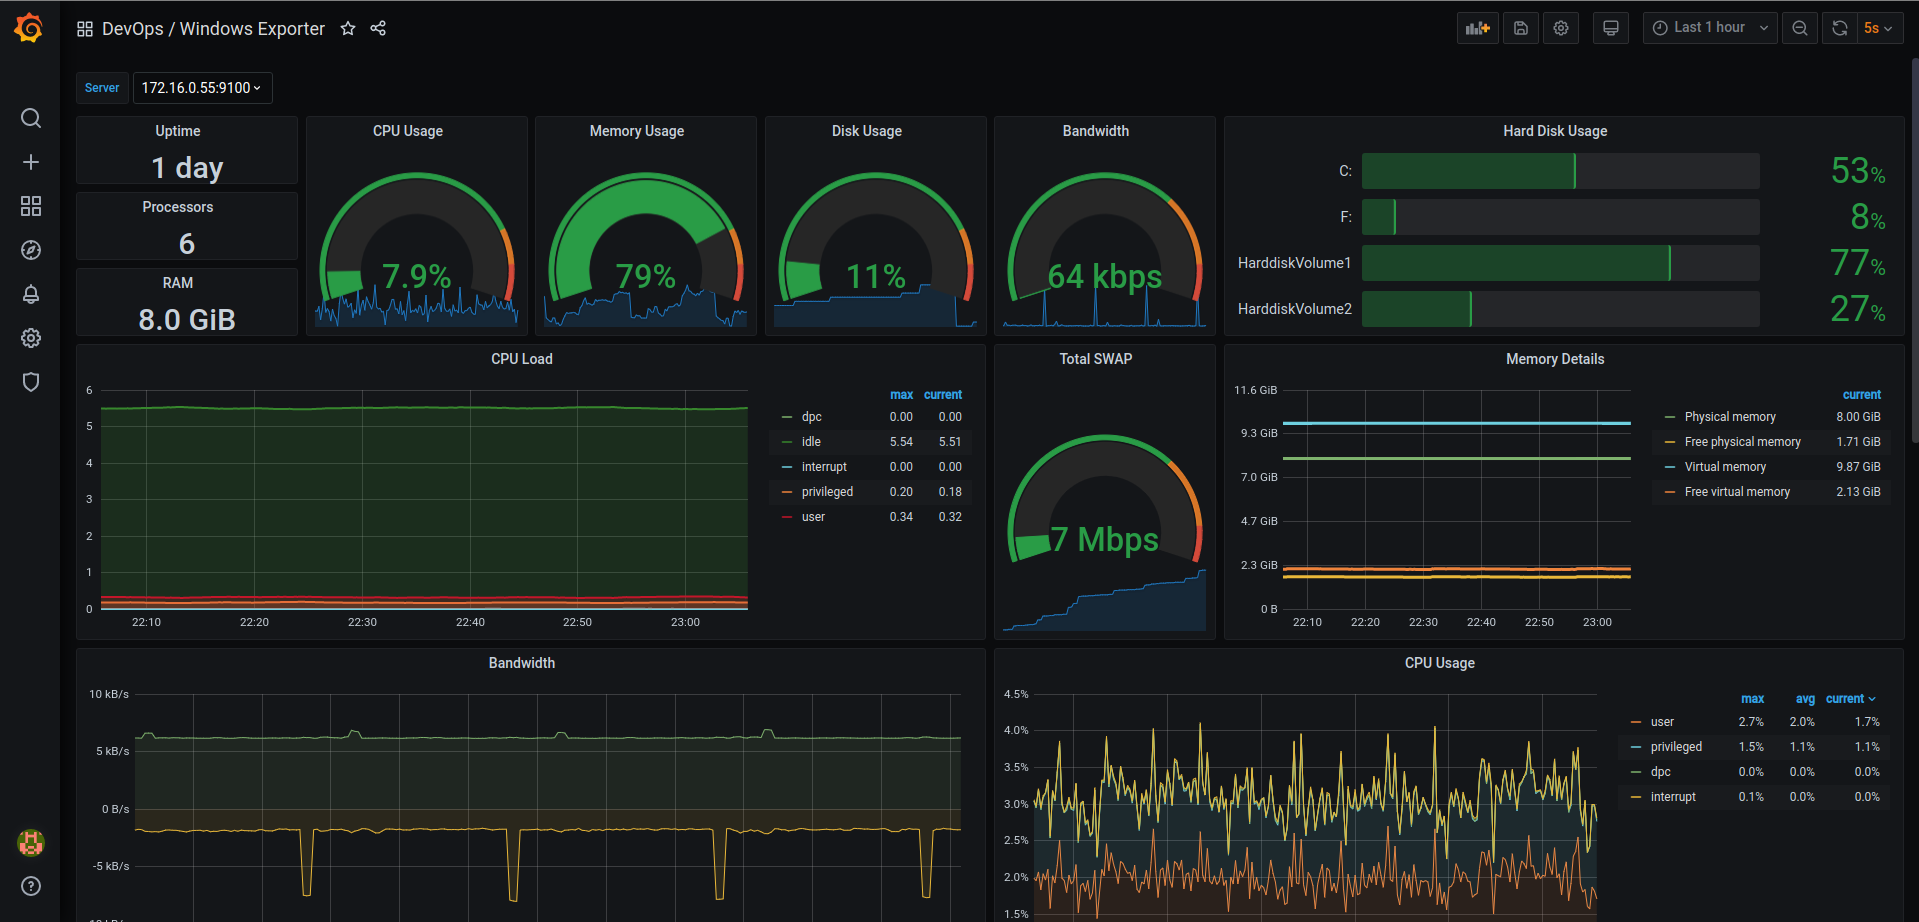
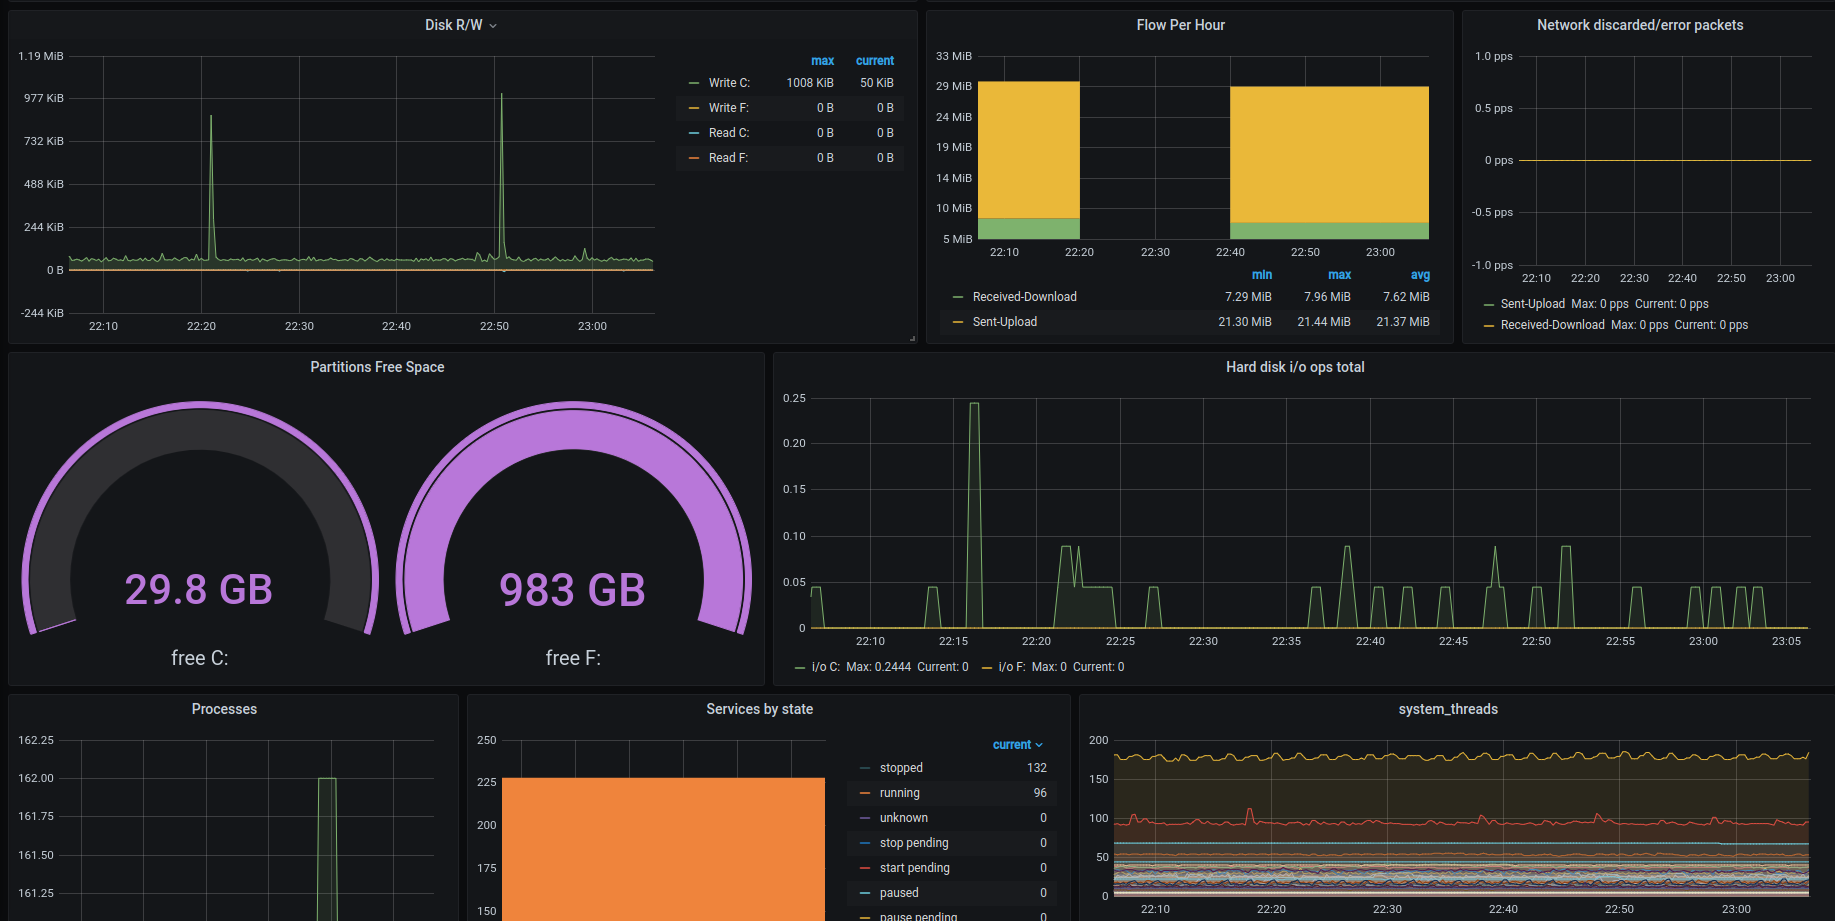
This dashboard monitors Windows host health and resource usage by aggregating time, CPU, memory, disk, network, and process metrics from Windows exporters. It highlights real-time and historical trends such as windows_os_time uptime, windows_cpu_time_total for CPU utilization, and windows_cs_physical_memory_bytes alongside free memory with windows_os_physical_memory_free_bytes; additional panels provide disk space, network bandwidth, and I/O activity to identify bottlenecks and system stability issues.
Screenshots
Used Metrics 2525
interval
windows_cpu_time_total
windows_cs_logical_processors
windows_cs_physical_memory_bytes
windows_logical_disk_free_bytes
windows_logical_disk_read_bytes_total
windows_logical_disk_size_bytes
windows_logical_disk_split_ios_total
windows_logical_disk_write_bytes_total
windows_memory_swap_page_operations_total
windows_net_bytes_received_total
windows_net_bytes_sent_total
windows_net_bytes_total
windows_net_current_bandwidth
windows_net_packets_outbound_discarded_total
windows_net_packets_outbound_errors_total
windows_os_physical_memory_free_bytes
windows_os_processes
windows_os_time
windows_os_virtual_memory_bytes
windows_os_virtual_memory_free_bytes
windows_process_start_time
windows_process_thread_count
windows_service_state
windows_time_computed_time_offset_seconds