Website monitoring 20,333,42120,333,421 3.7 (3 reviews)
9/20/2020
3/19/2021
4
Web Servers
>=7.2.0
Prometheus
Description
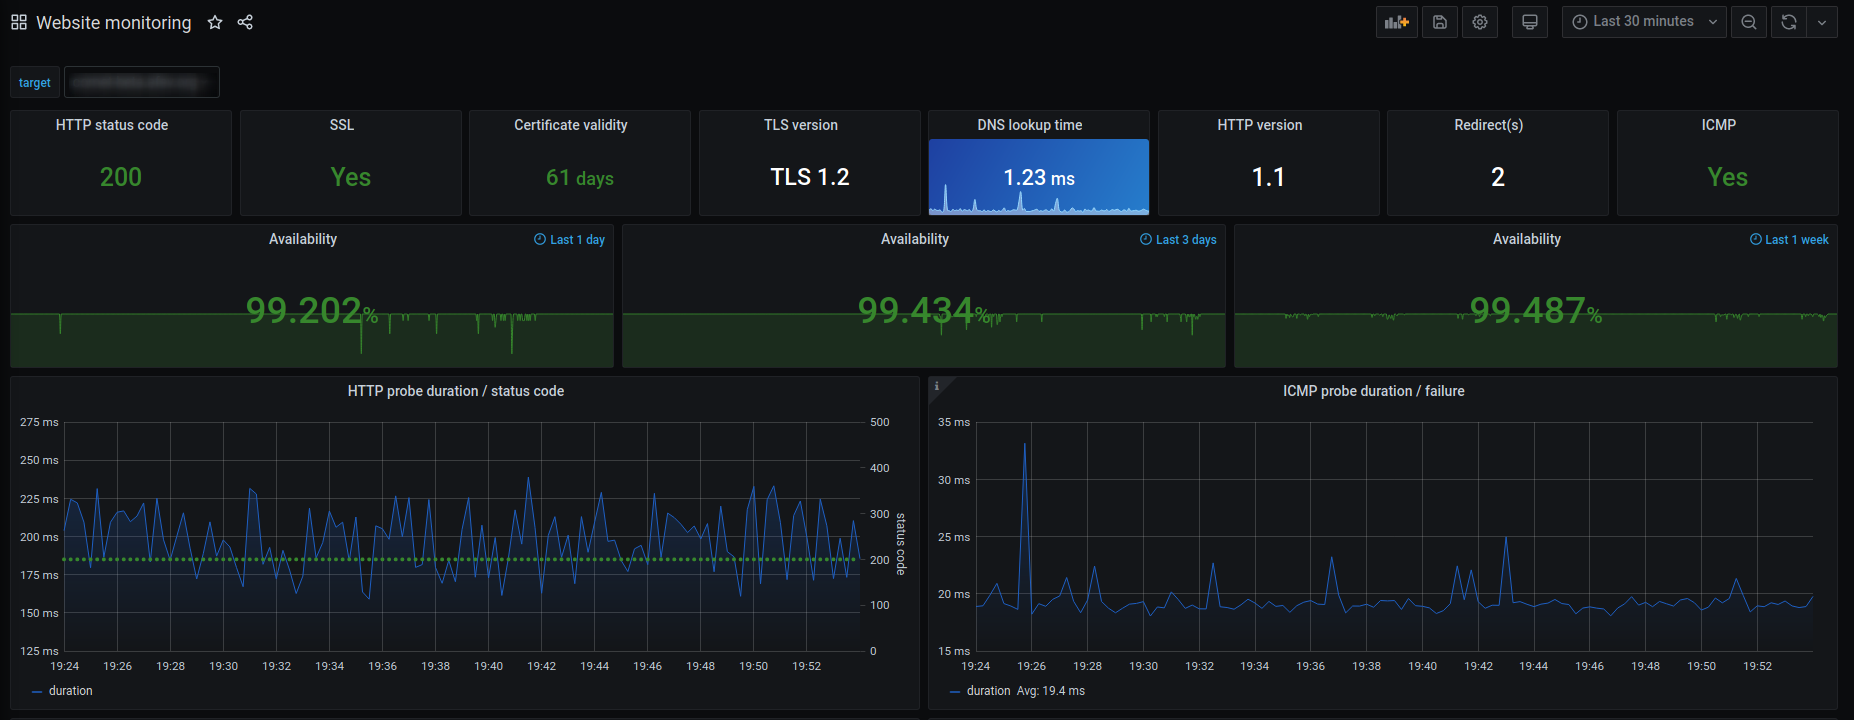
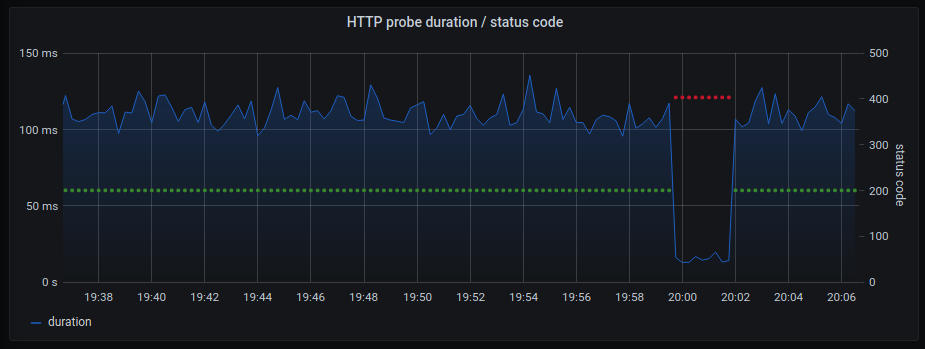
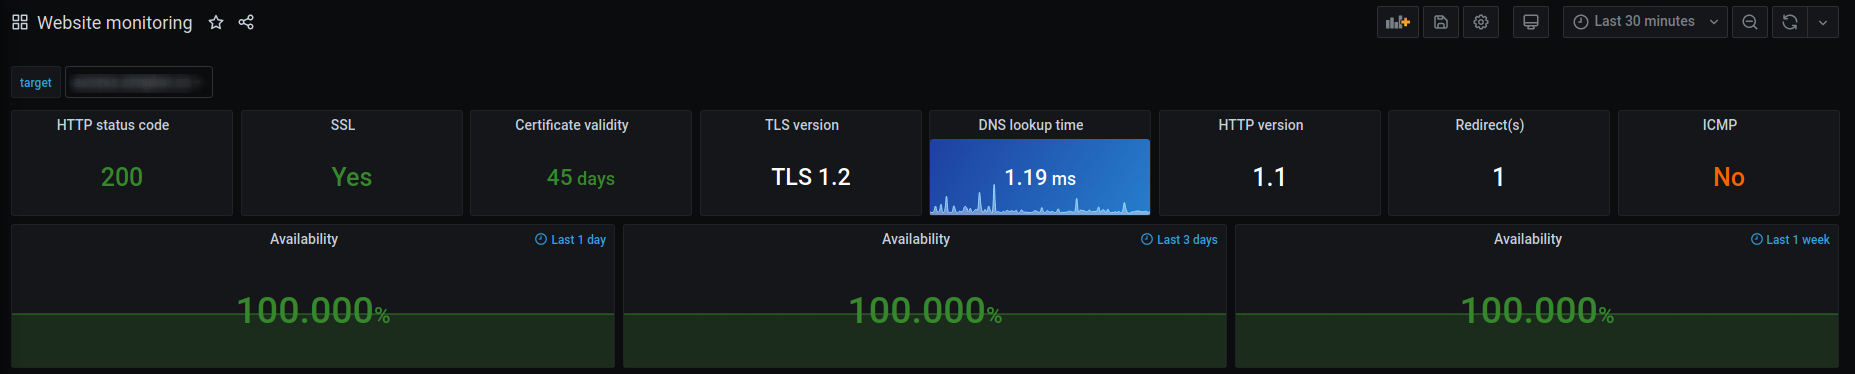
This dashboard monitors end-to-end website health and performance by tracking HTTP status codes, SSL certificate validity, TLS versions, DNS lookup times, HTTP versions, and redirects across multiple probes. It emphasizes availability metrics and probe duration, with key indicators such as probe_http_status_code, probe_ssl_earliest_cert_expiry, probe_tls_version_info, and probe_dns_lookup_time_seconds to surface potential SSL, DNS, or HTTP issues; it also includes by-phase drilldowns like probe_http_duration_seconds and probe_http_redirects for deeper troubleshooting.
Screenshots
Get Dashboard✕
Download
Copy to Clipboard