WebLogic Server Dashboard 795795
Description
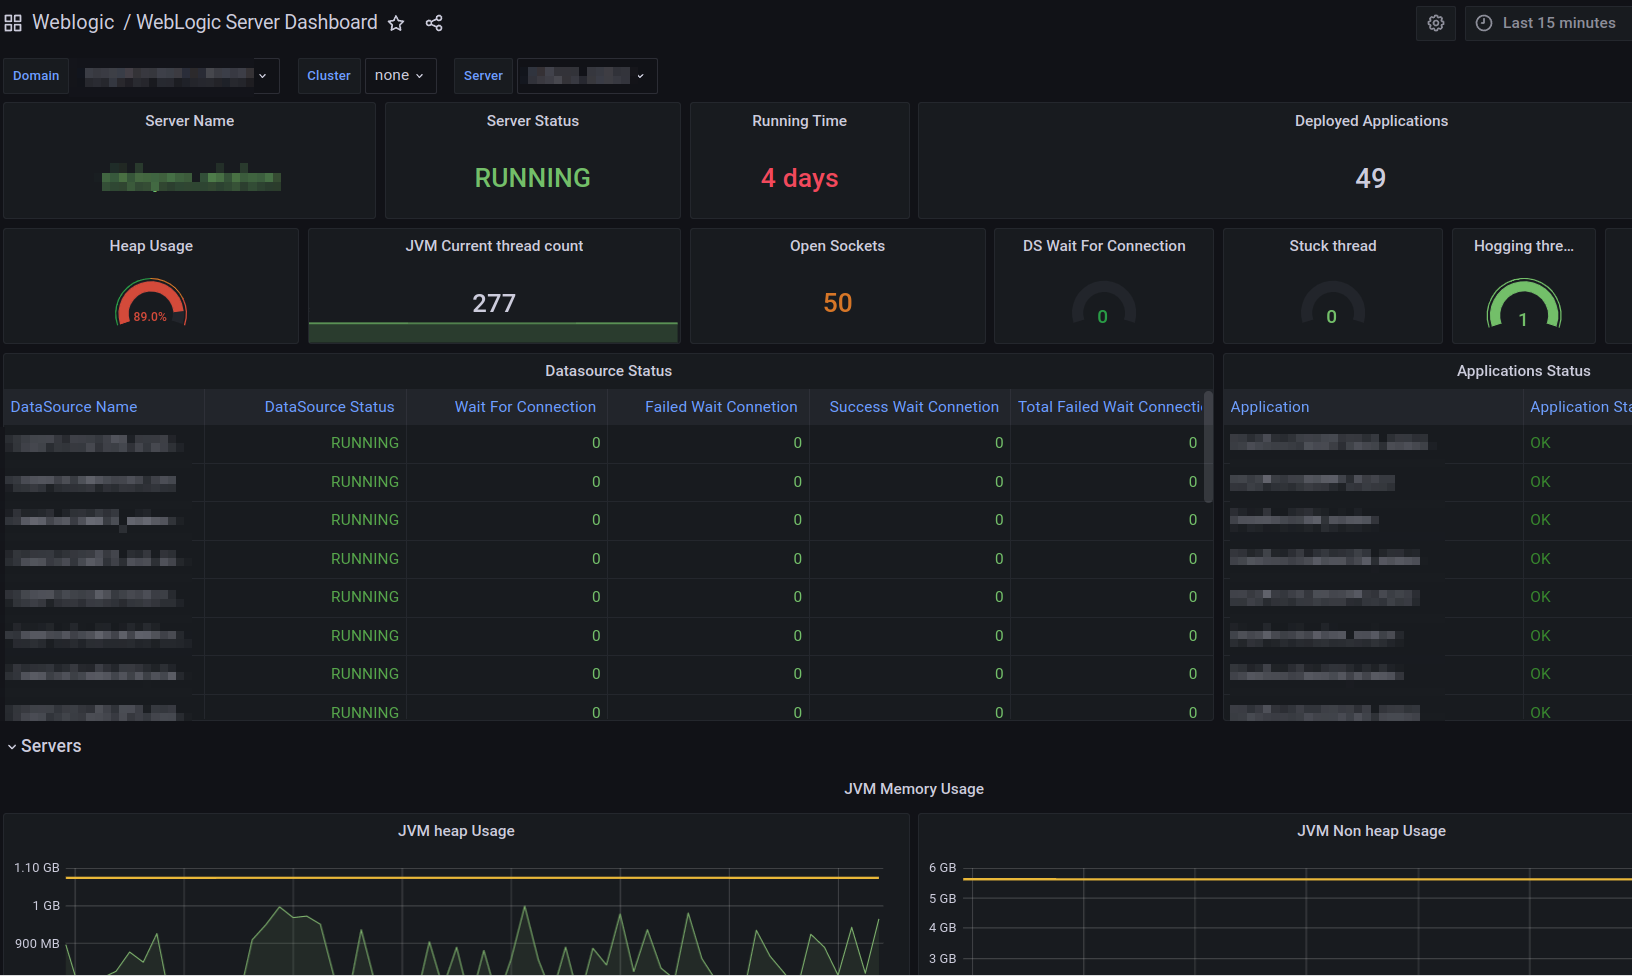
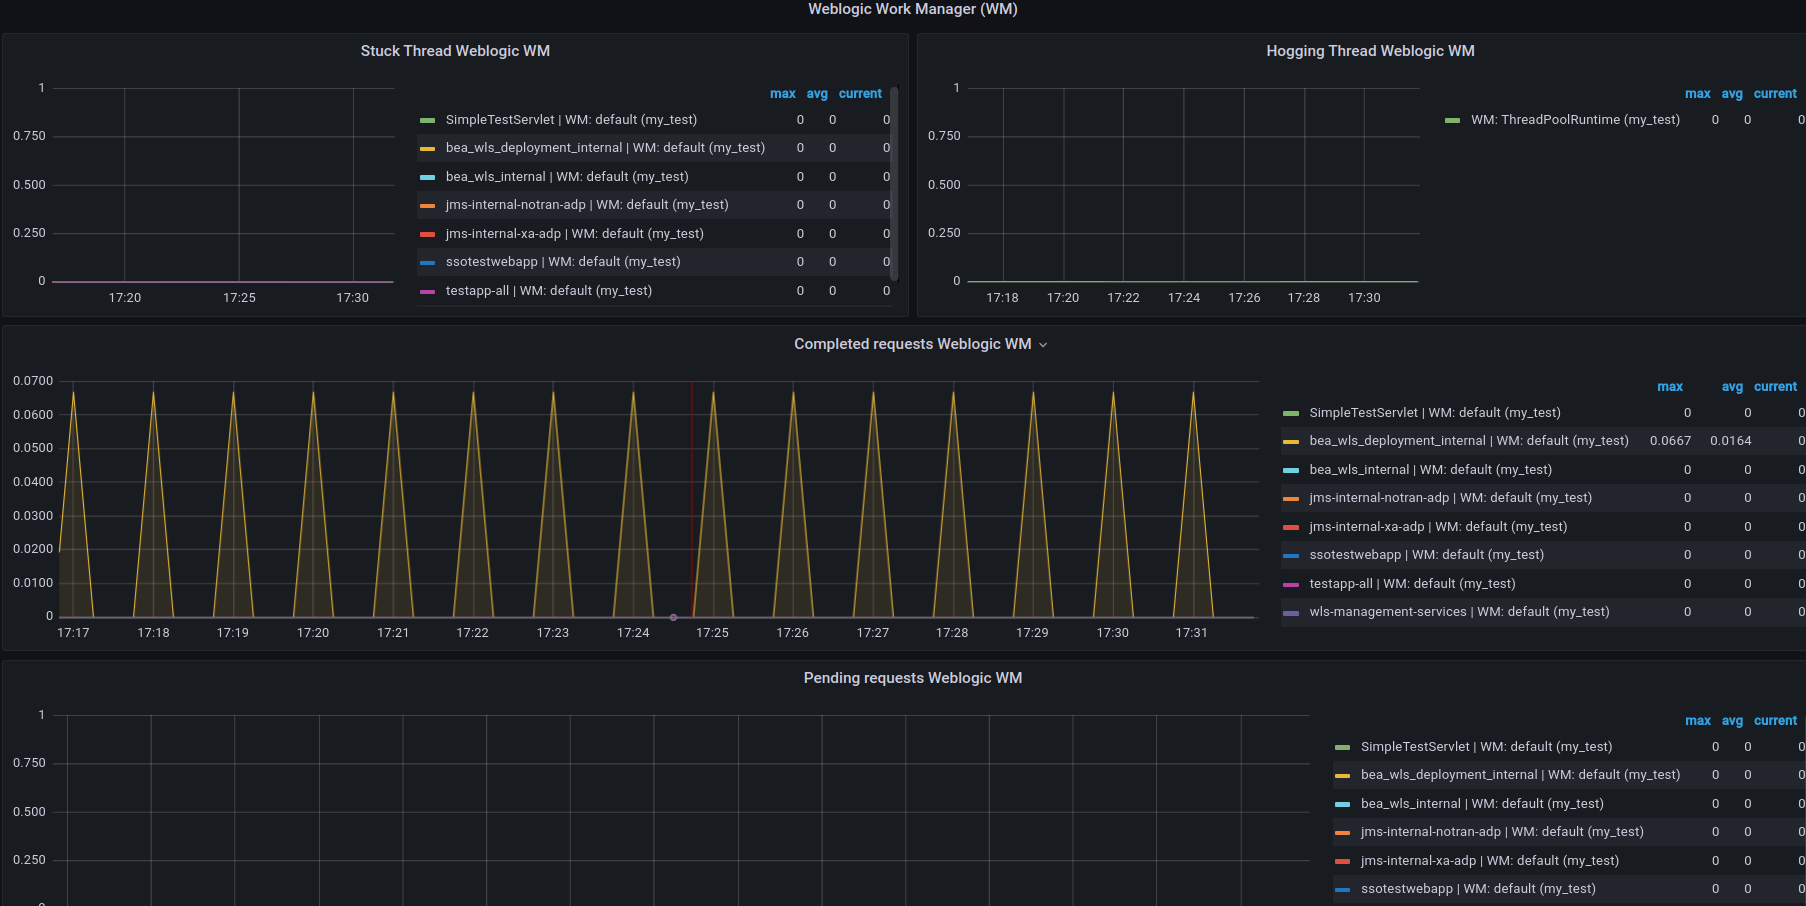
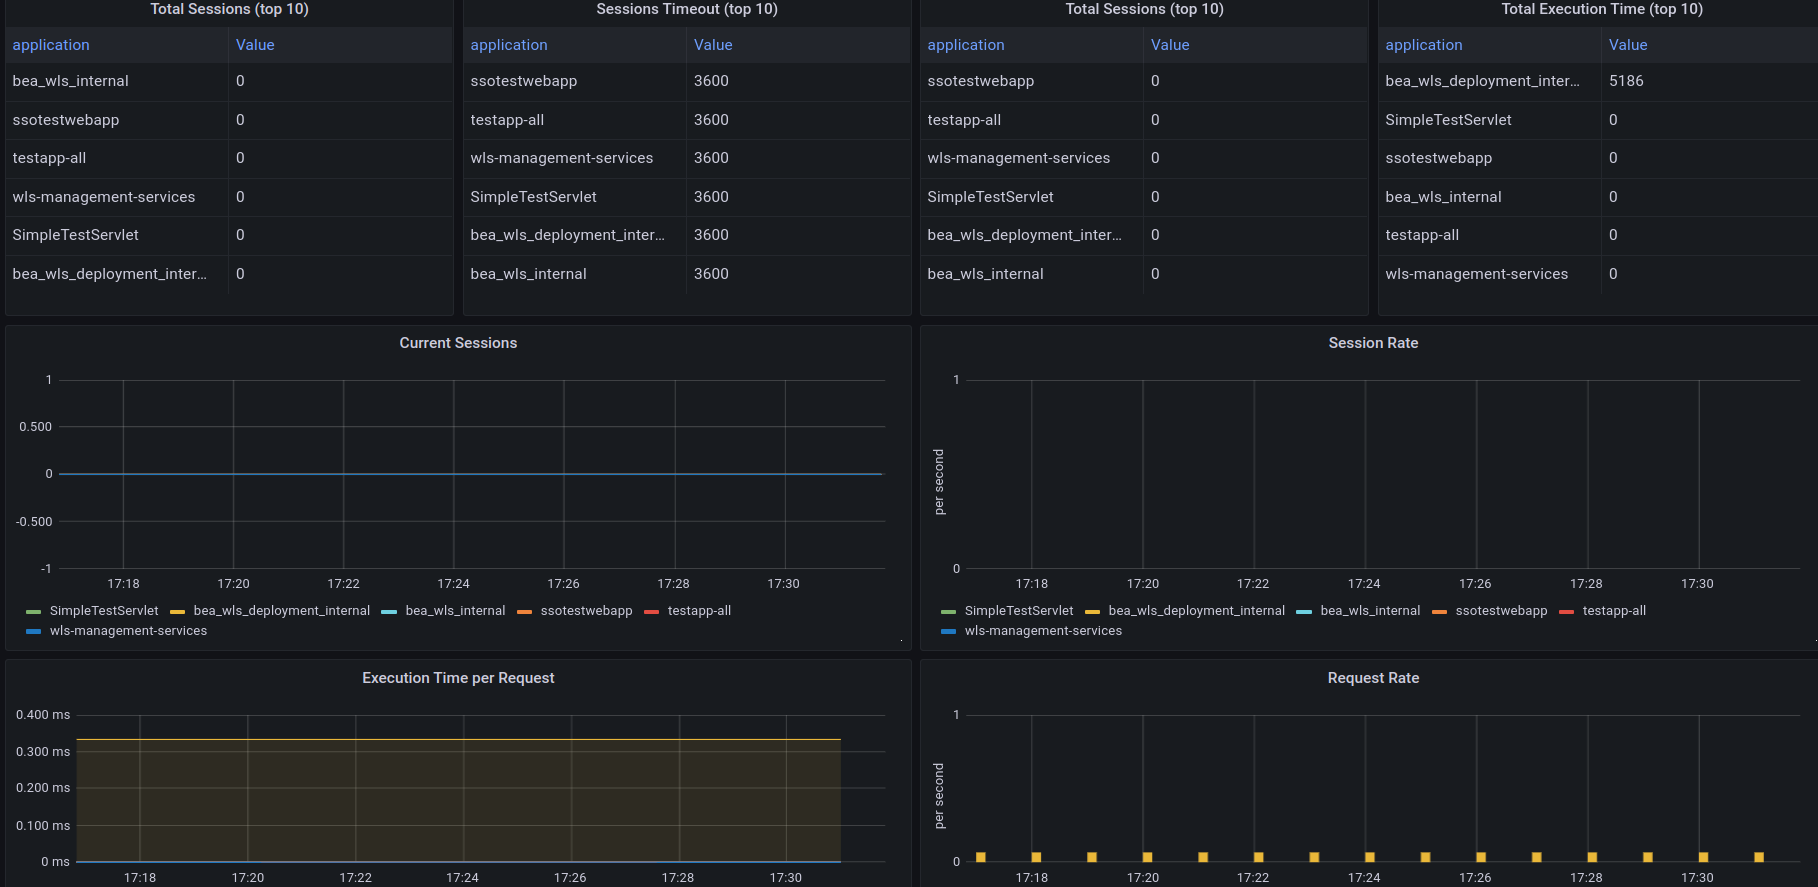
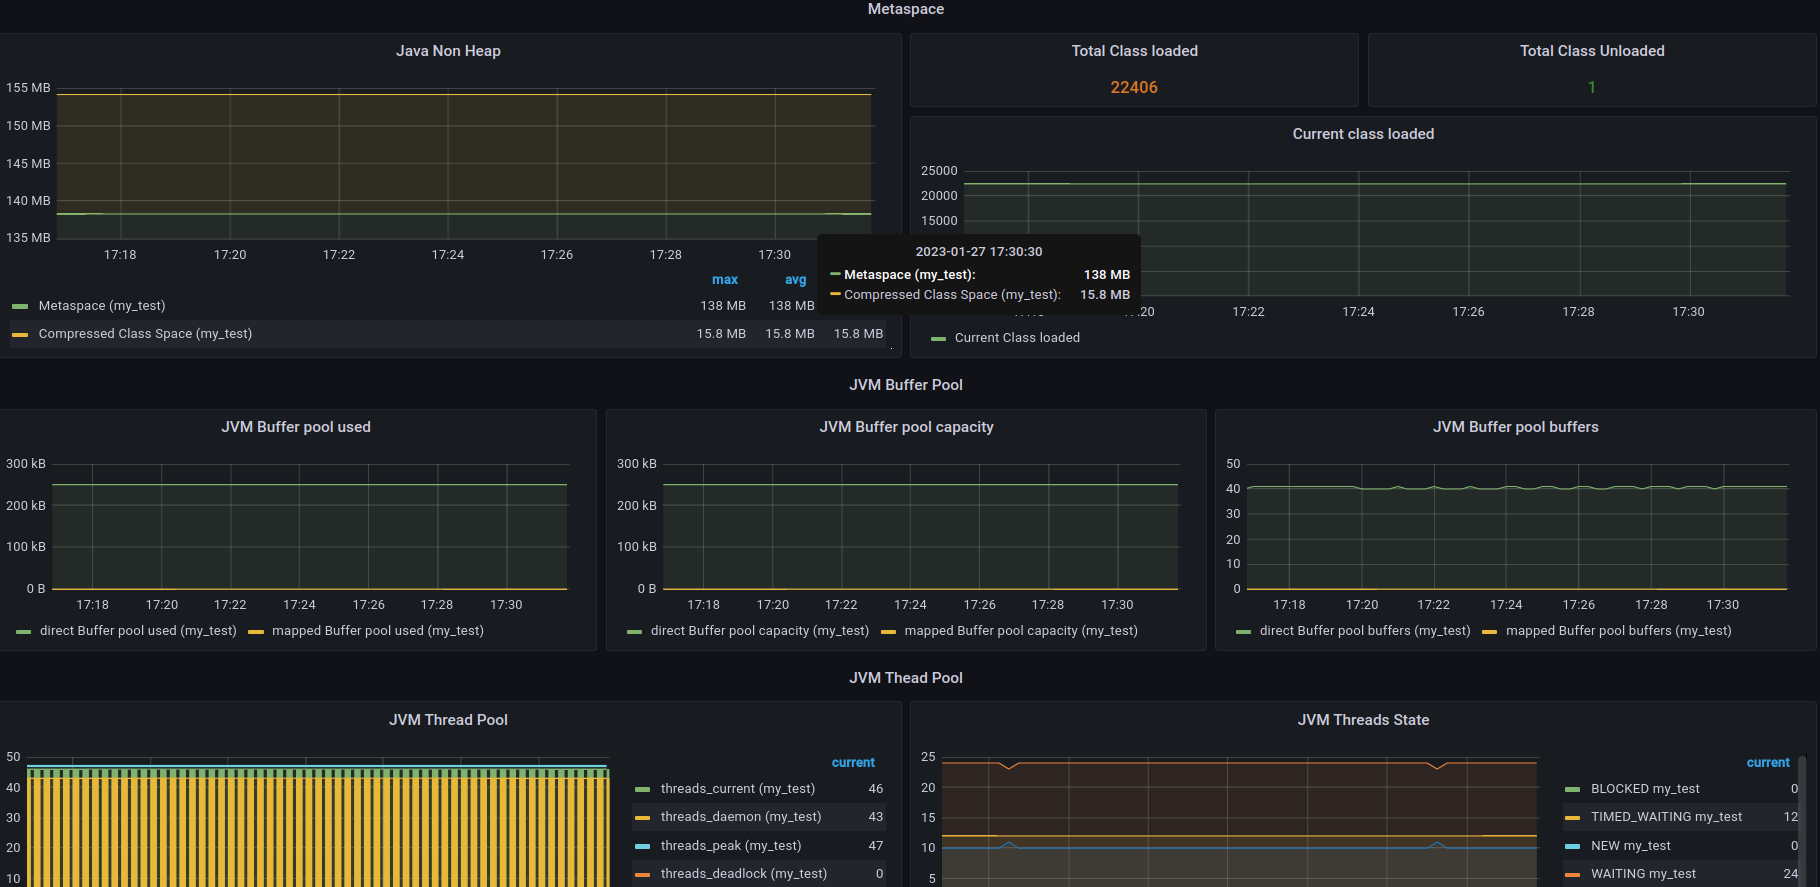
Weblogic Server
Screenshots
Used Metrics 6464
jvm_buffer_pool_capacity_bytes
jvm_buffer_pool_used_buffers
jvm_buffer_pool_used_bytes
jvm_classes_loaded
jvm_classes_loaded_total
jvm_classes_unloaded_total
jvm_gc_collection_seconds_count
jvm_gc_collection_seconds_sum
jvm_memory_bytes_committed
jvm_memory_bytes_max
jvm_memory_bytes_used
jvm_memory_pool_bytes_commited
jvm_memory_pool_bytes_init
jvm_memory_pool_bytes_max
jvm_memory_pool_bytes_used
jvm_threads_current
jvm_threads_daemon
jvm_threads_deadlocked
jvm_threads_peak
jvm_threads_state
topk
weblogic_application_active_version_state
weblogic_application_execution_time_total
weblogic_application_invocation_total_count
weblogic_application_webappcomponent_deployment_state
weblogic_application_webappcomponent_open_sessions_current_count
weblogic_application_webappcomponent_session_timeout_secs
weblogic_application_webappcomponent_sessions_opened_total_count
weblogic_application_workmanager_completed_daemon_requests
weblogic_application_workmanager_completed_requests
weblogic_application_workmanager_pending_daemon_requests
weblogic_application_workmanager_pending_requests
weblogic_application_workmanager_stuck_thread_count
weblogic_jdbcdatasource_active_connections_current_count
weblogic_jdbcdatasource_active_connections_high_count
weblogic_jdbcdatasource_connection_delay_time
weblogic_jdbcdatasource_connections_total_count
weblogic_jdbcdatasource_curr_capacity
weblogic_jdbcdatasource_enabled
weblogic_jdbcdatasource_failed_reserve_request_count
weblogic_jdbcdatasource_highest_num_available
weblogic_jdbcdatasource_leaked_connection_count
weblogic_jdbcdatasource_prep_stmt_cache_access_count
weblogic_jdbcdatasource_prep_stmt_cache_current_size
weblogic_jdbcdatasource_prep_stmt_cache_hit_count
weblogic_jdbcdatasource_prep_stmt_cache_miss_count
weblogic_jdbcdatasource_wait_seconds_high_count
weblogic_jdbcdatasource_waiting_for_connection_current_count
weblogic_jdbcdatasource_waiting_for_connection_failure_total
weblogic_jdbcdatasource_waiting_for_connection_high_count
weblogic_jdbcdatasource_waiting_for_connection_success_total
weblogic_jdbcdatasource_waiting_for_connection_total
weblogic_jvm_heap_free_percent
weblogic_jvm_uptime
weblogic_server_activation_time
weblogic_server_open_sockets_current_count
weblogic_server_stable_state
weblogic_system_cpu_load
weblogic_threadpool_execute_thread_total_count
weblogic_threadpool_hogging_thread_count
weblogic_threadpool_overload_rejected_requests_count
weblogic_threadpool_queue_length
weblogic_threadpool_stuck_thread_count
weblogic_threadpool_throughput