WeaveNet (Cluster) 5,7595,759
2/26/2020
2/27/2020
3
>=6.6.0
Description
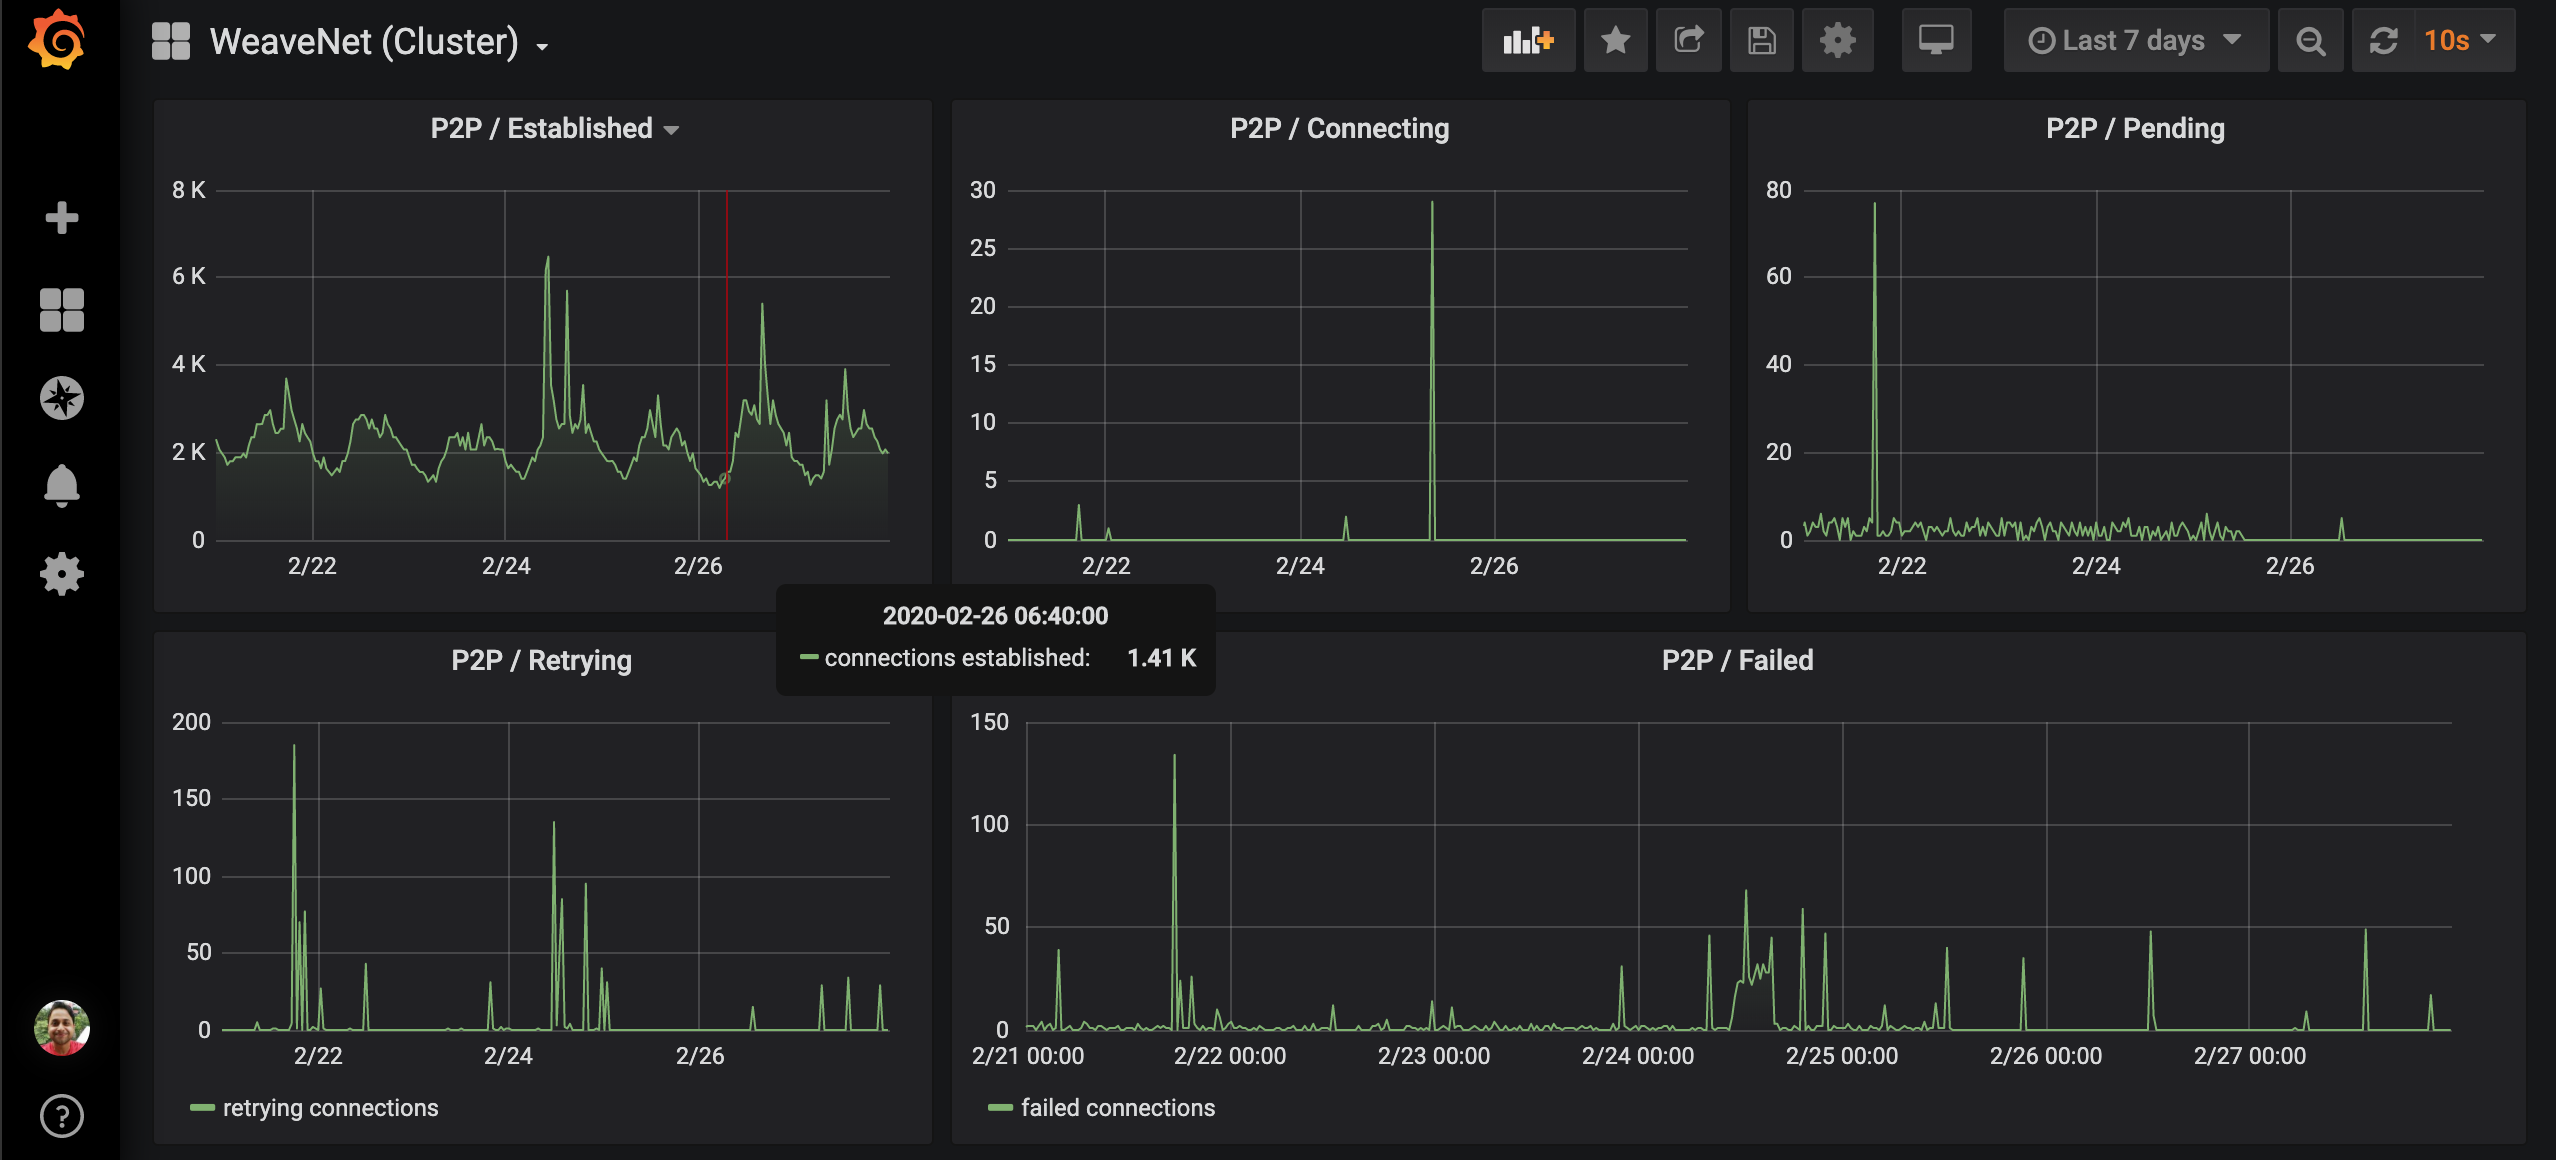
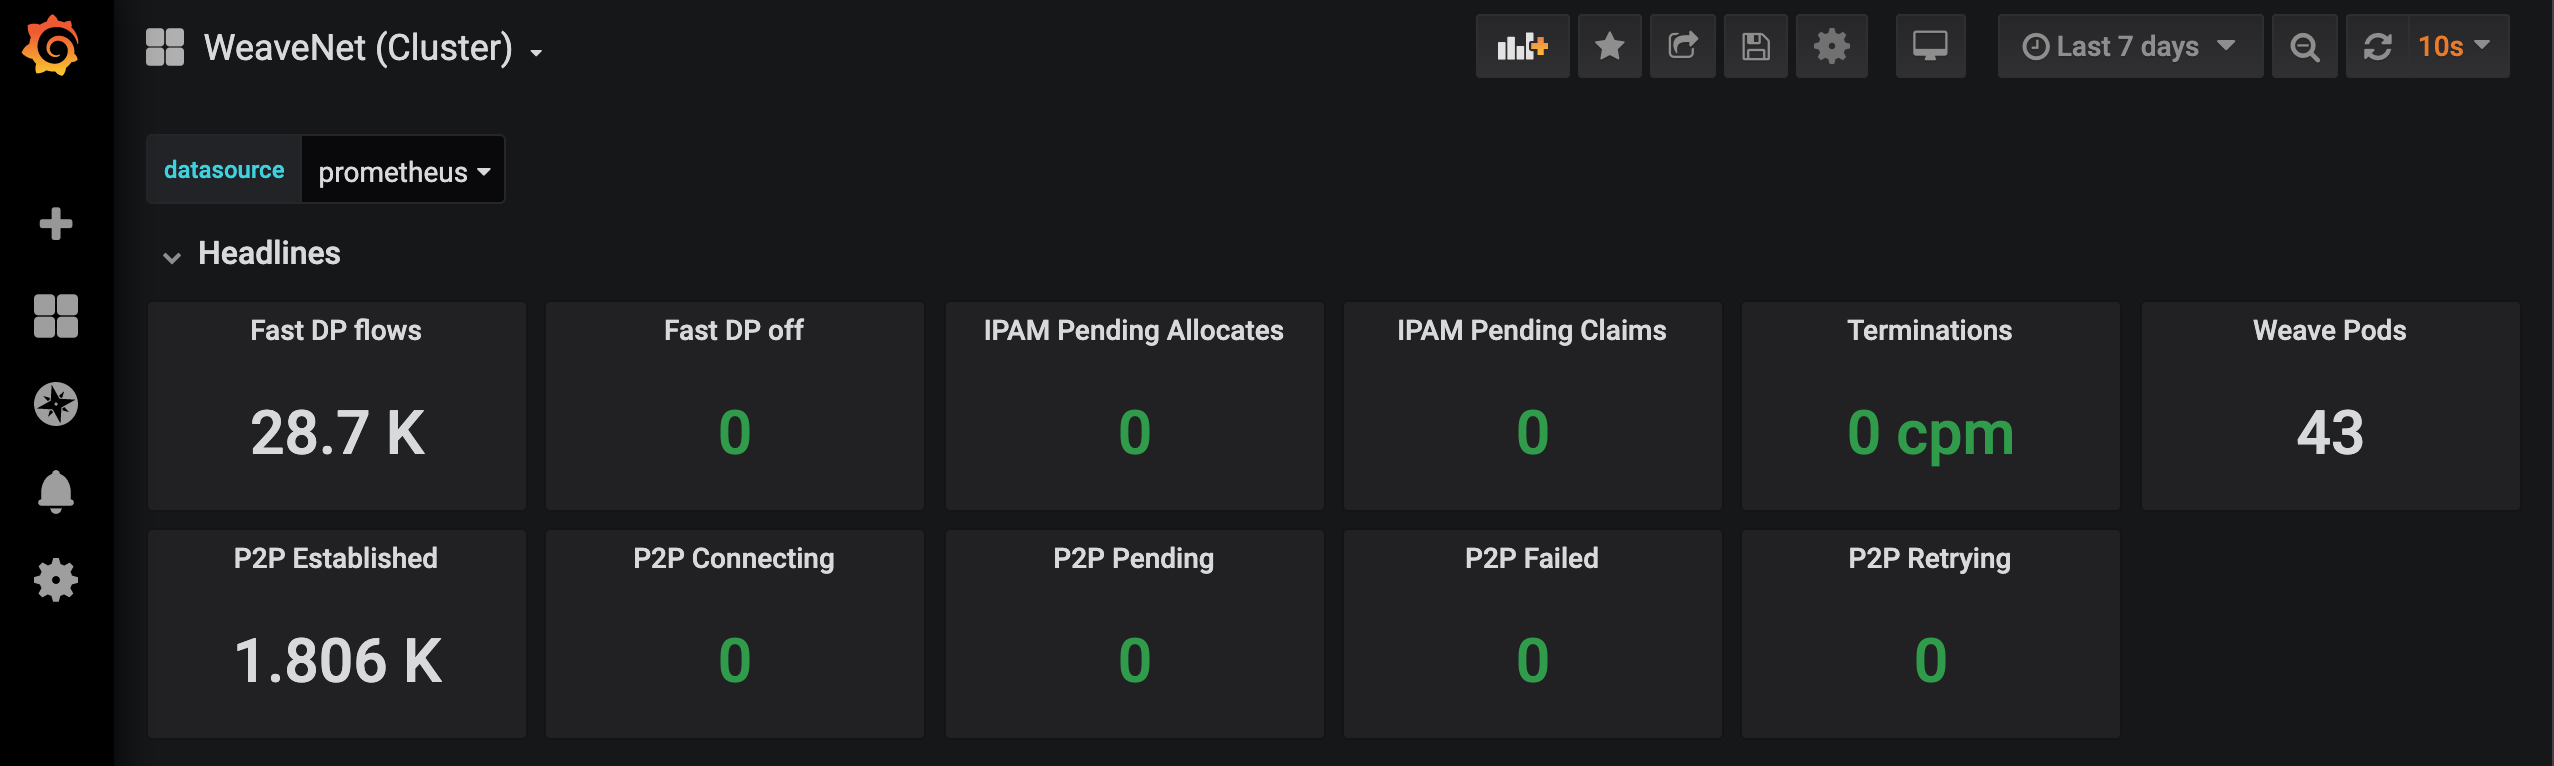
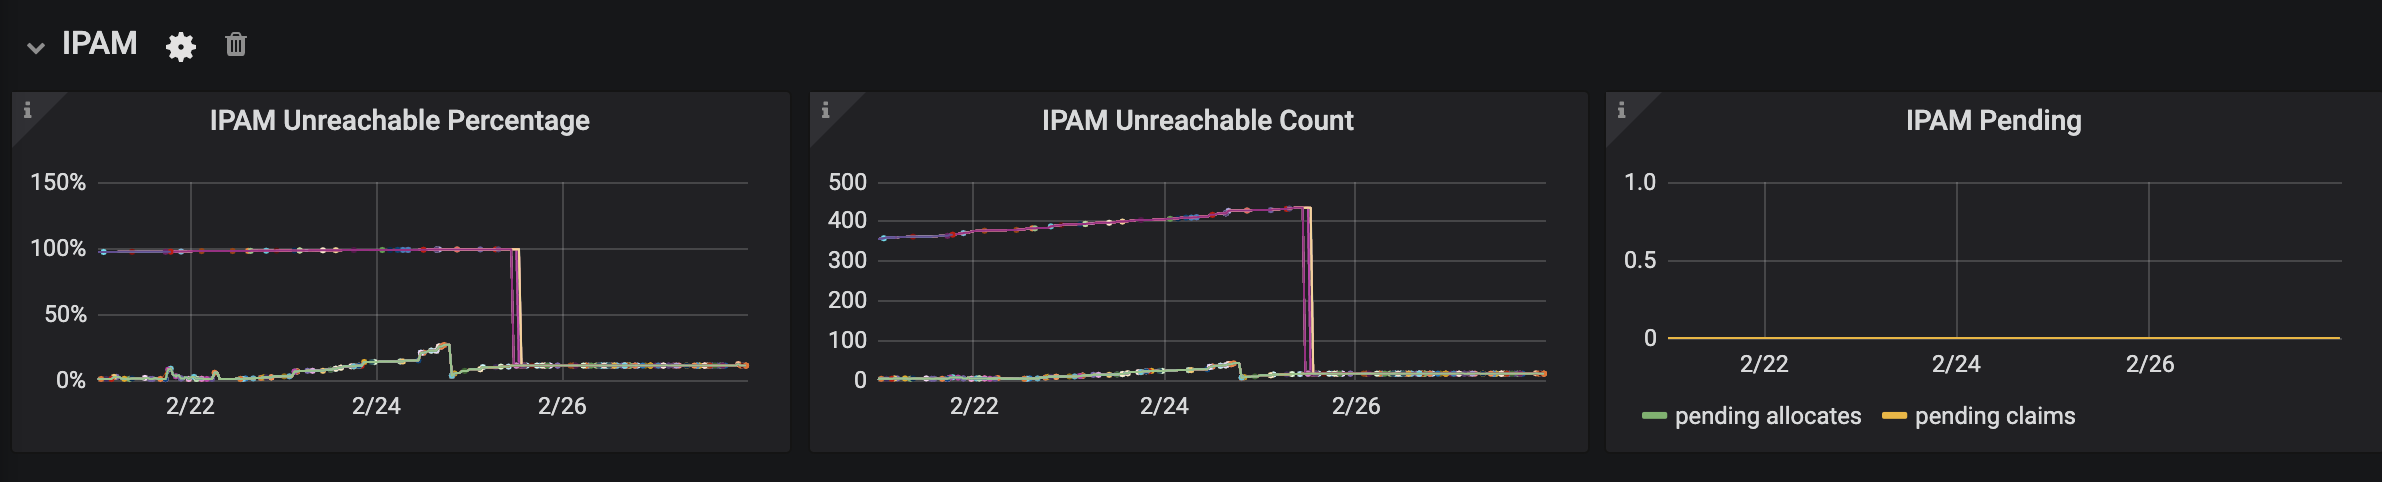
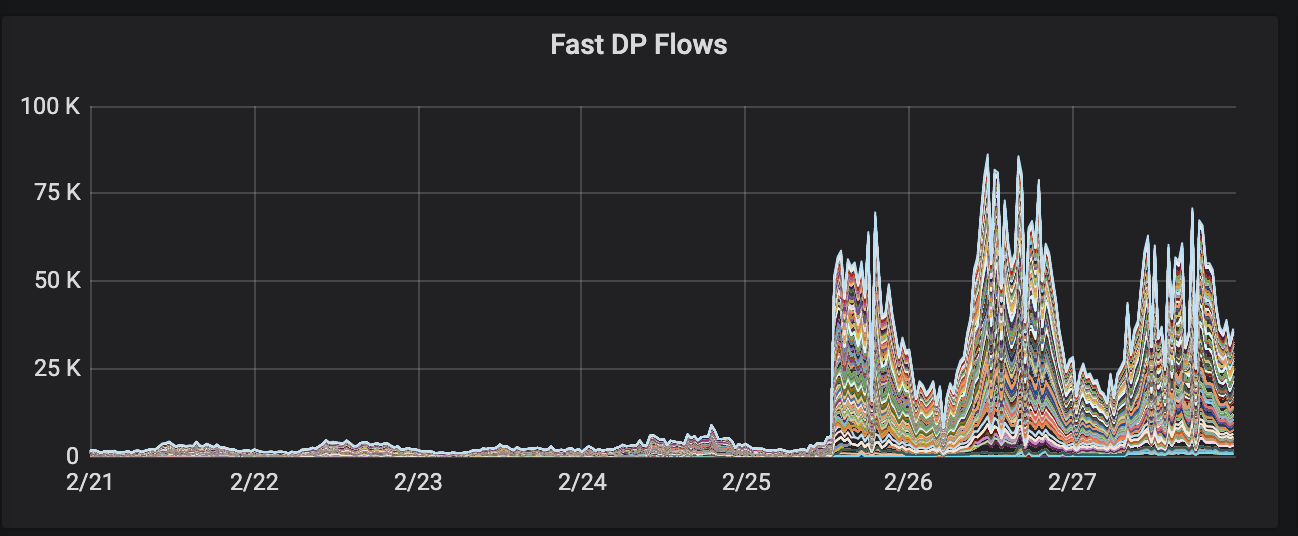
WeaveNet metrics at the cluster level. It was made on top of the weavenet prometheus metrics. Please check this for more details https://www.weave.works/docs/net/latest/tasks/manage/metrics
Screenshots
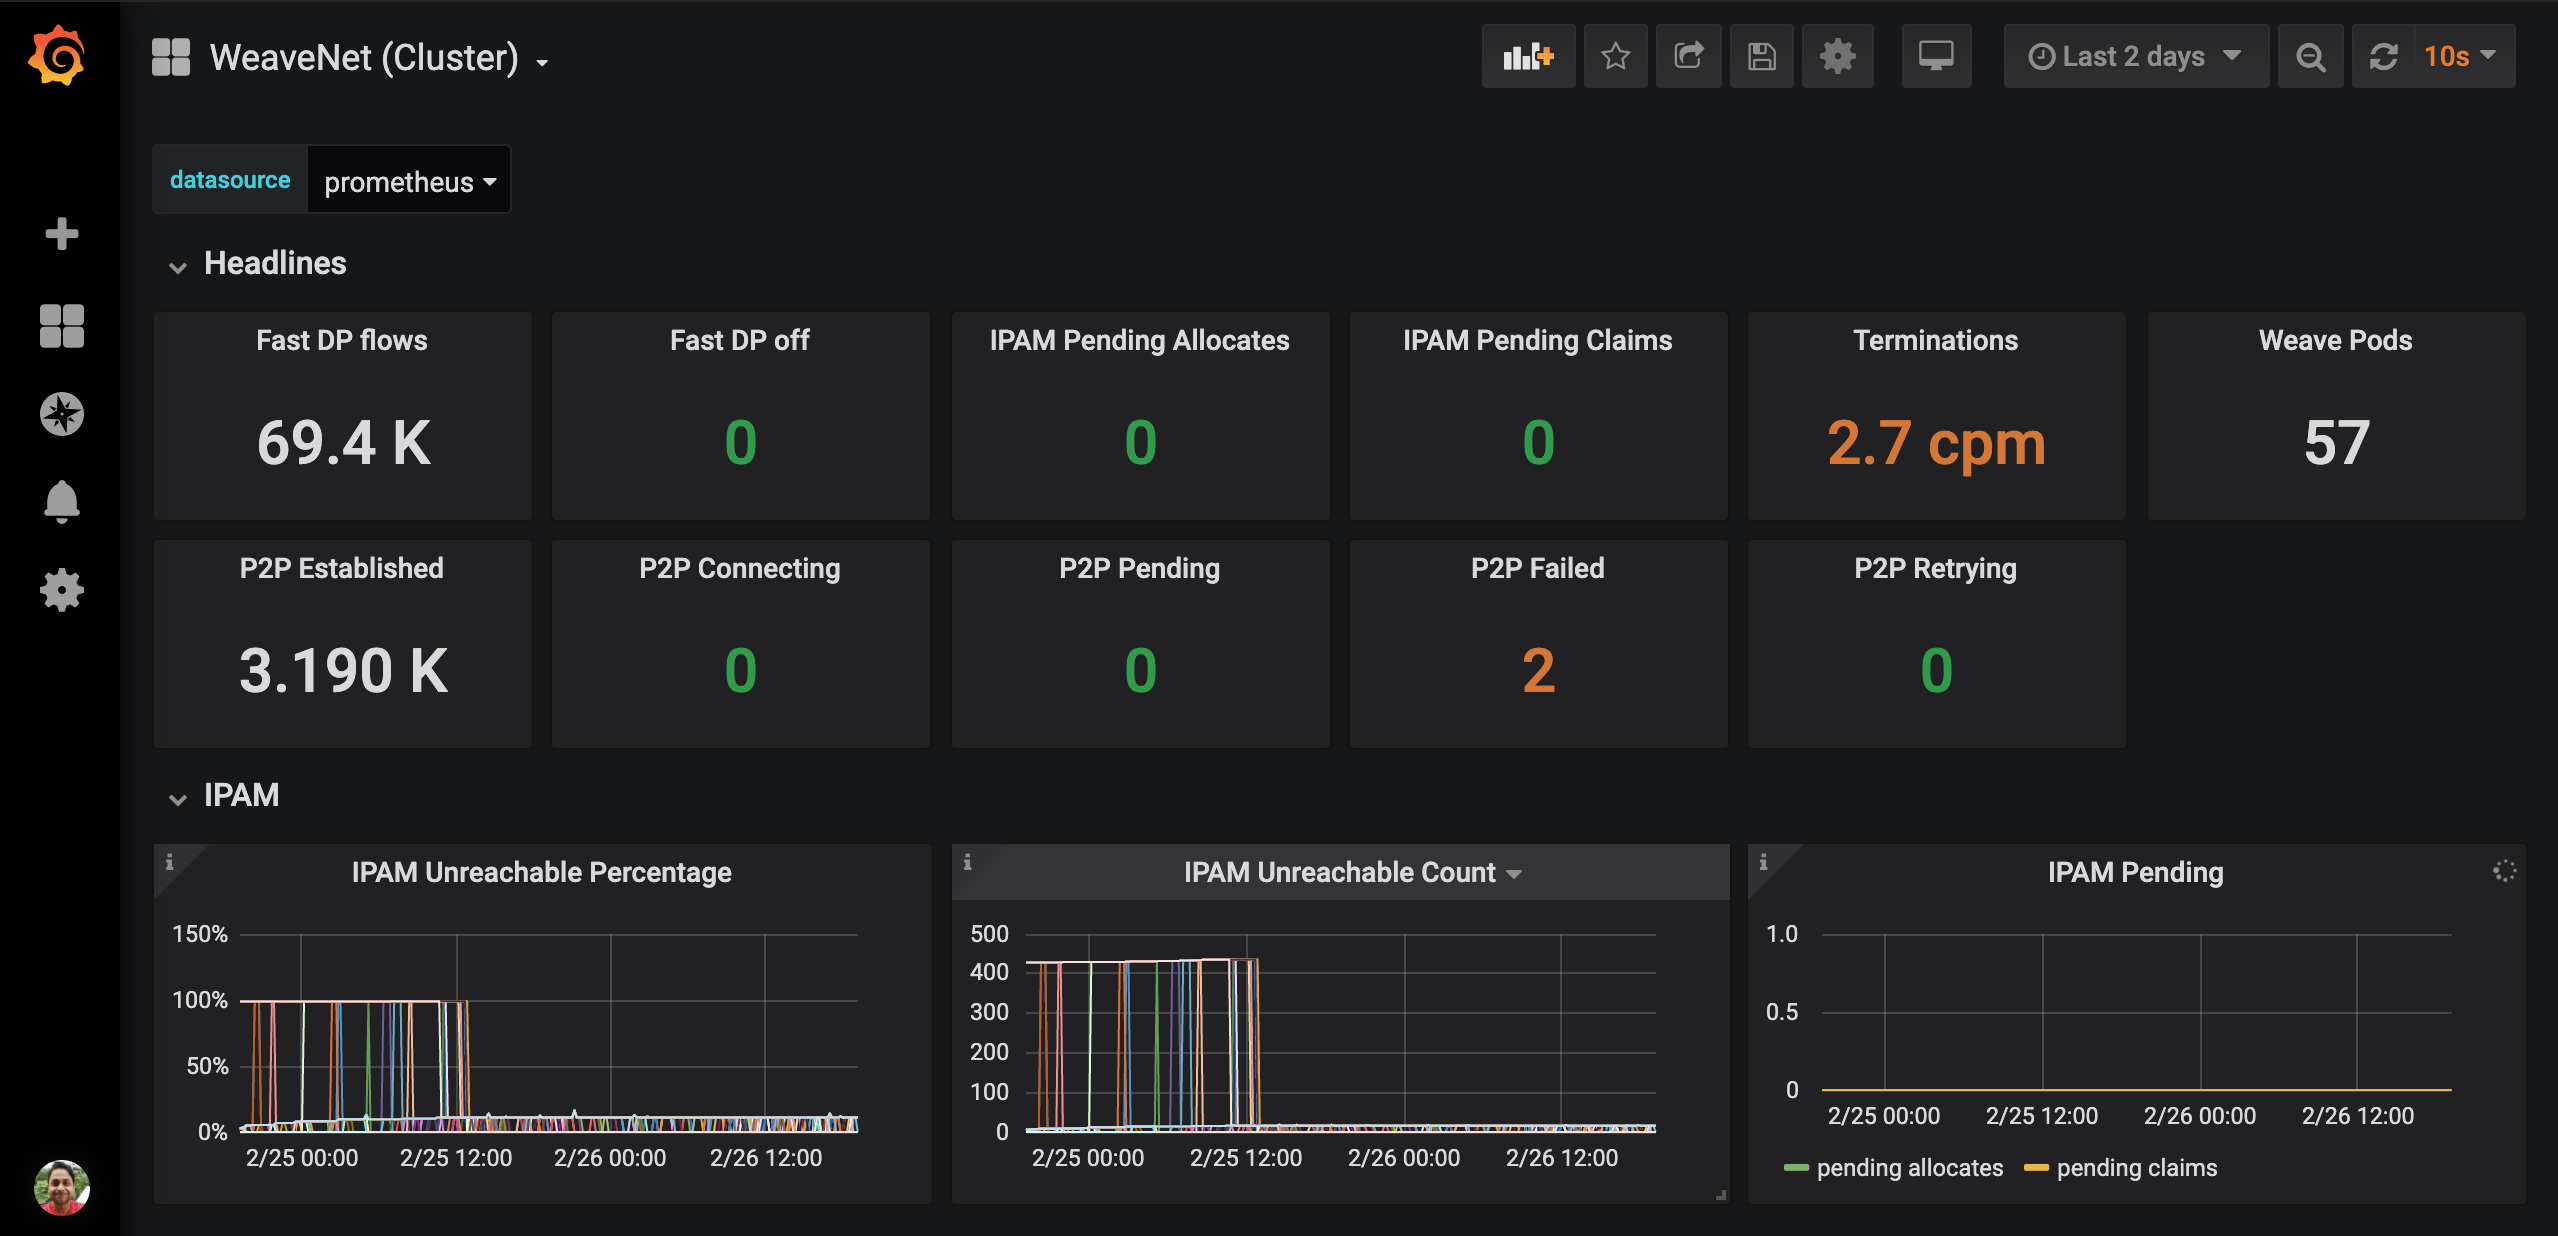
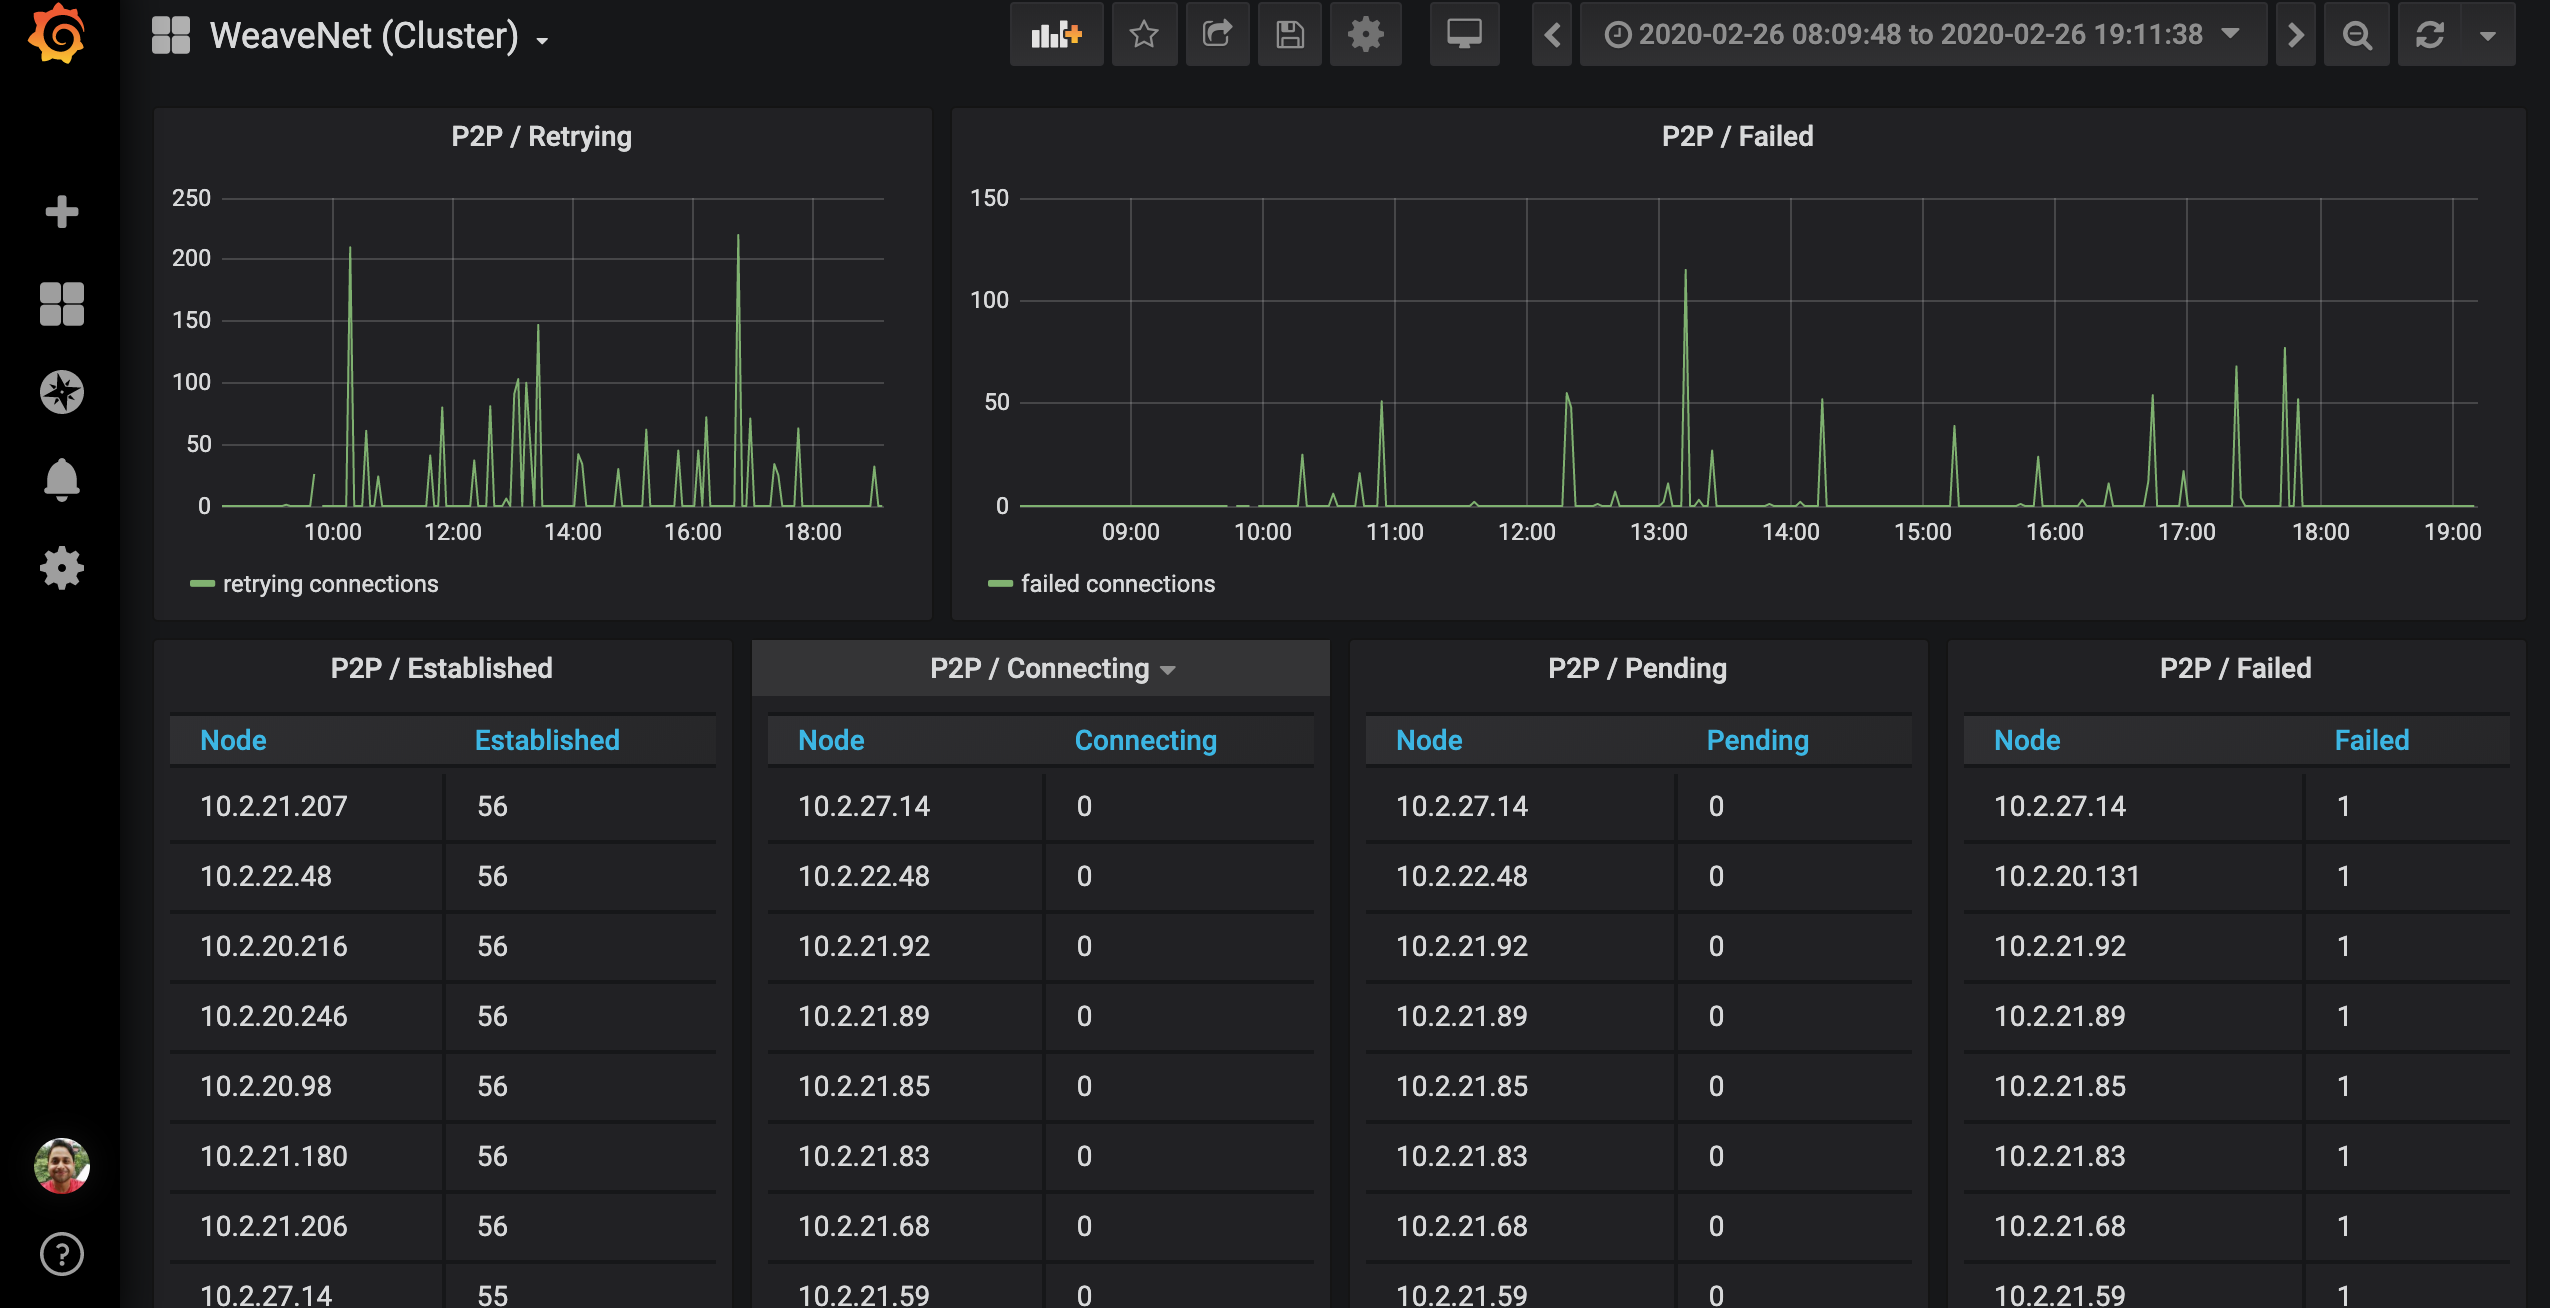
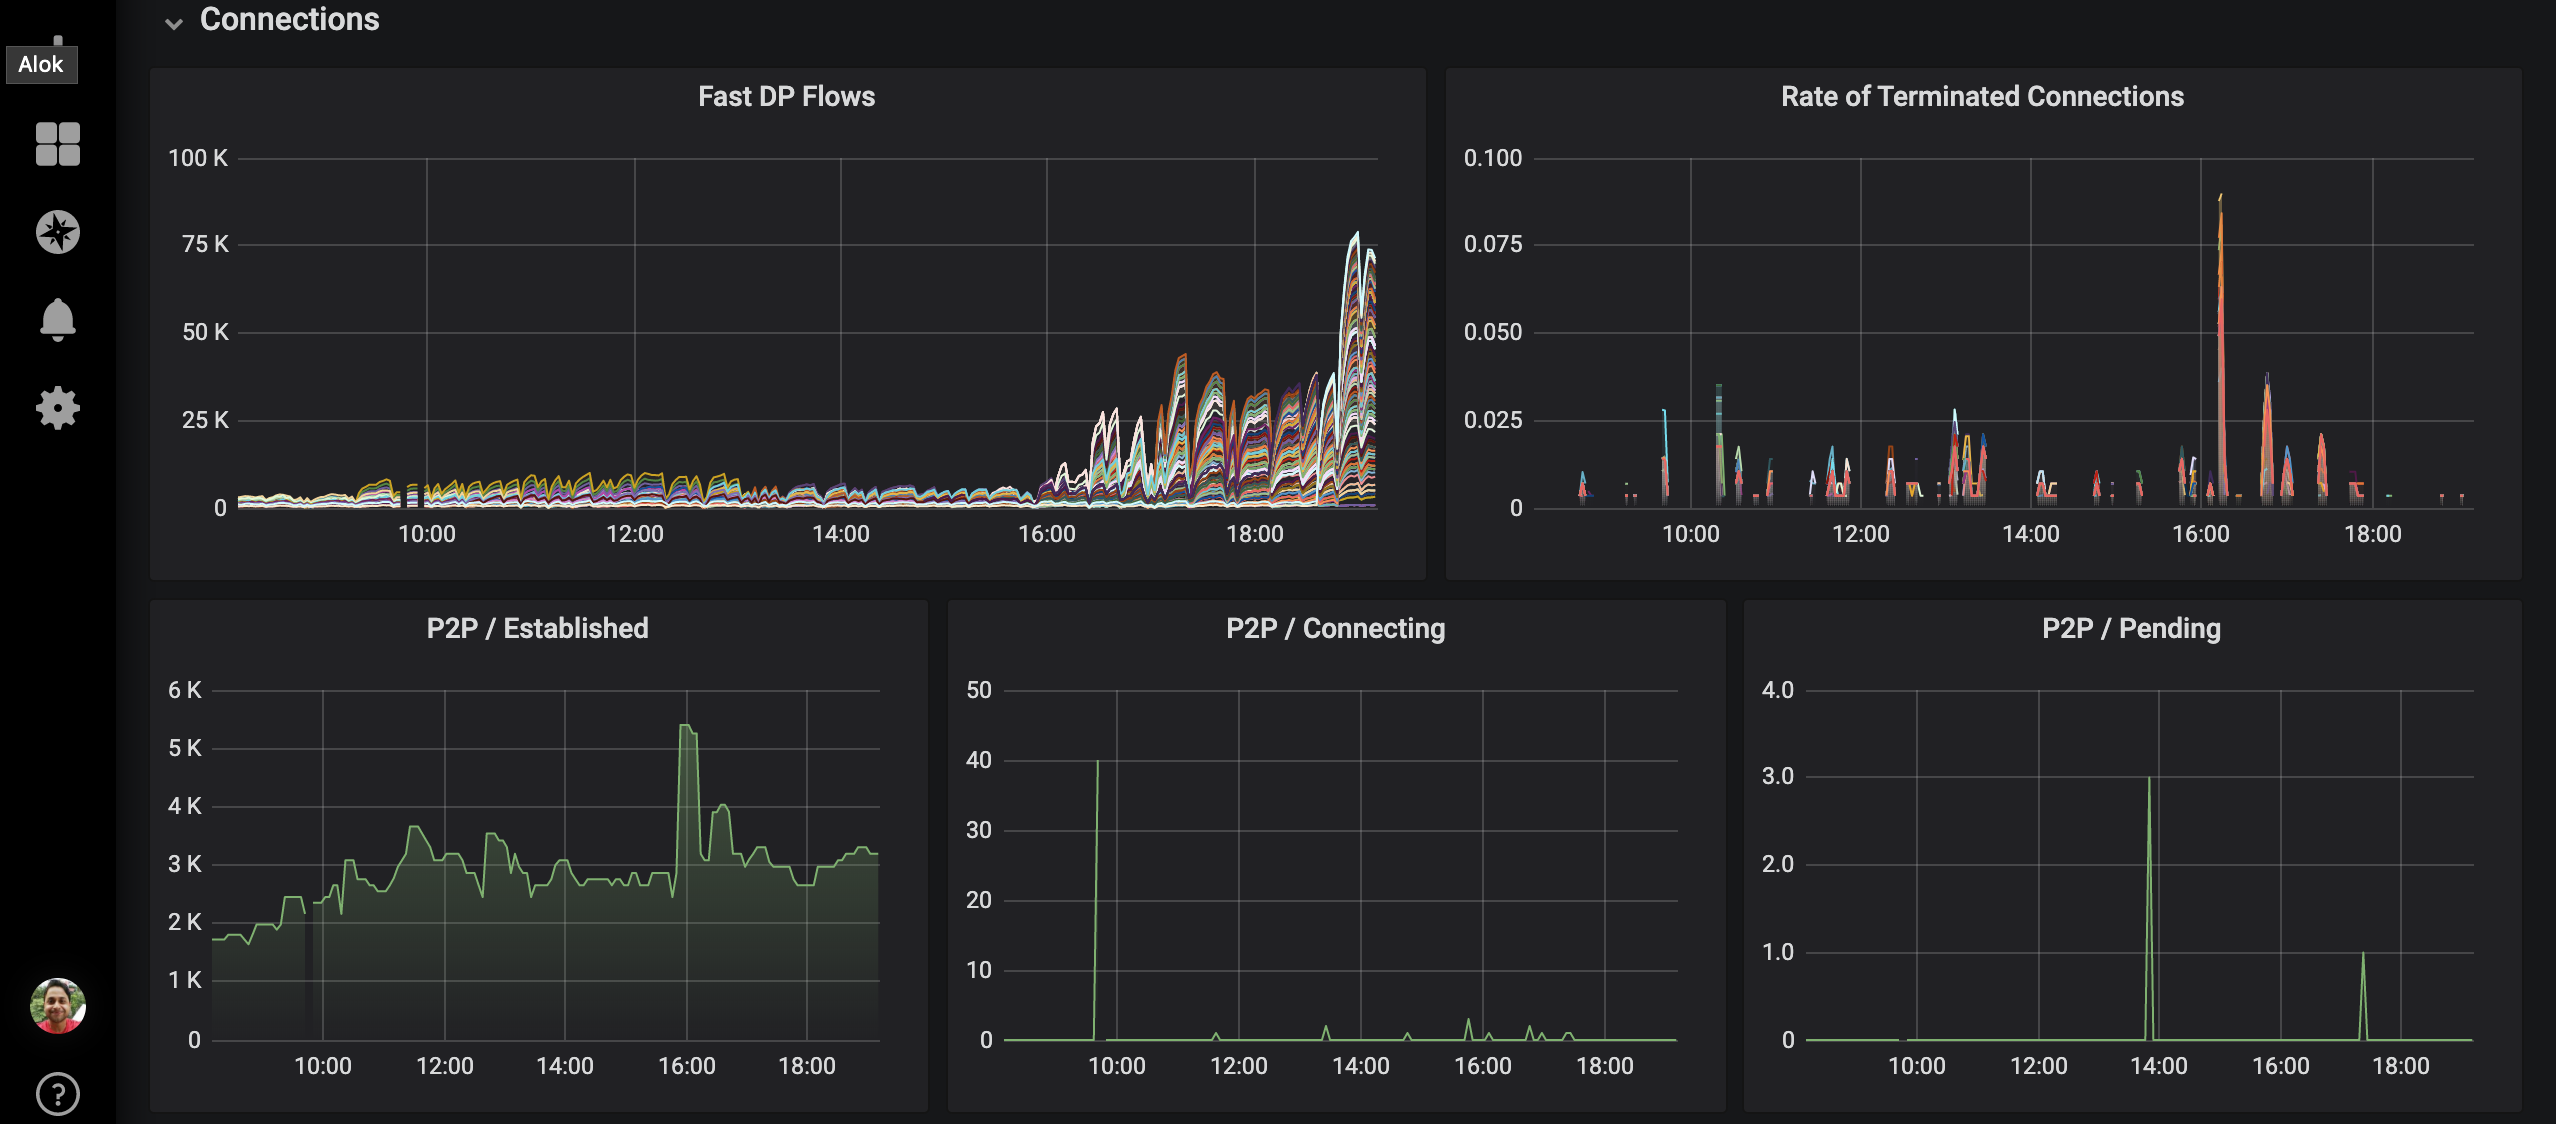
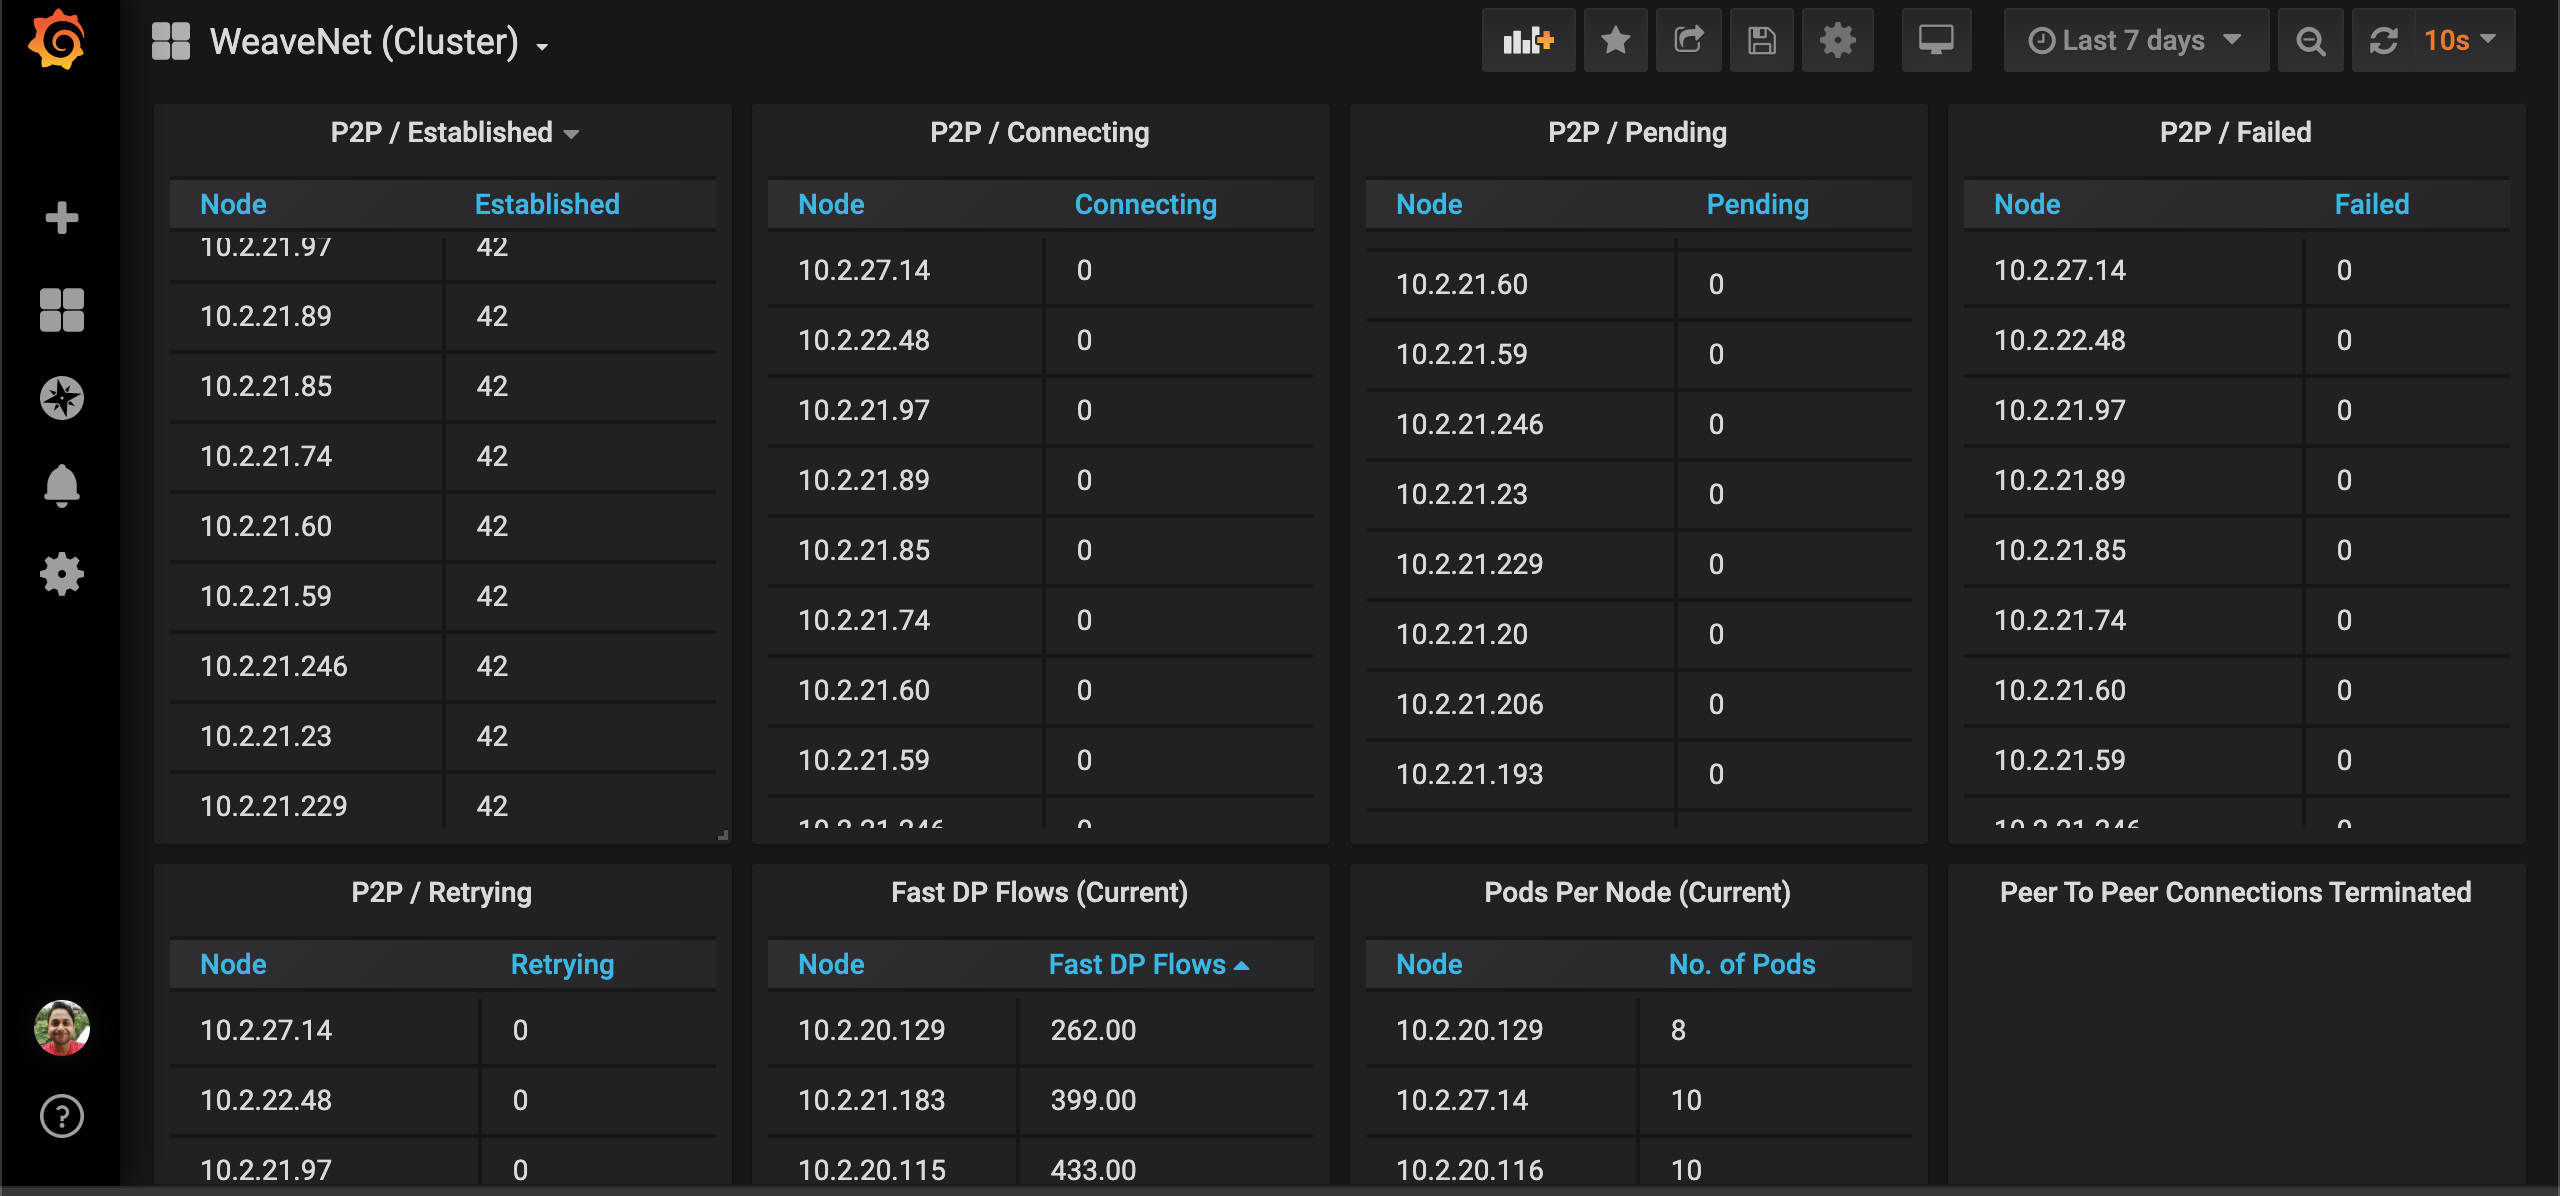
Used Metrics 1616
:
central_nodeagent:node_route_unhealthy_count
instance
ip
kube_node_status_capacity_pods
kubelet_node_name
kubelet_running_pod_count
node
node_ip
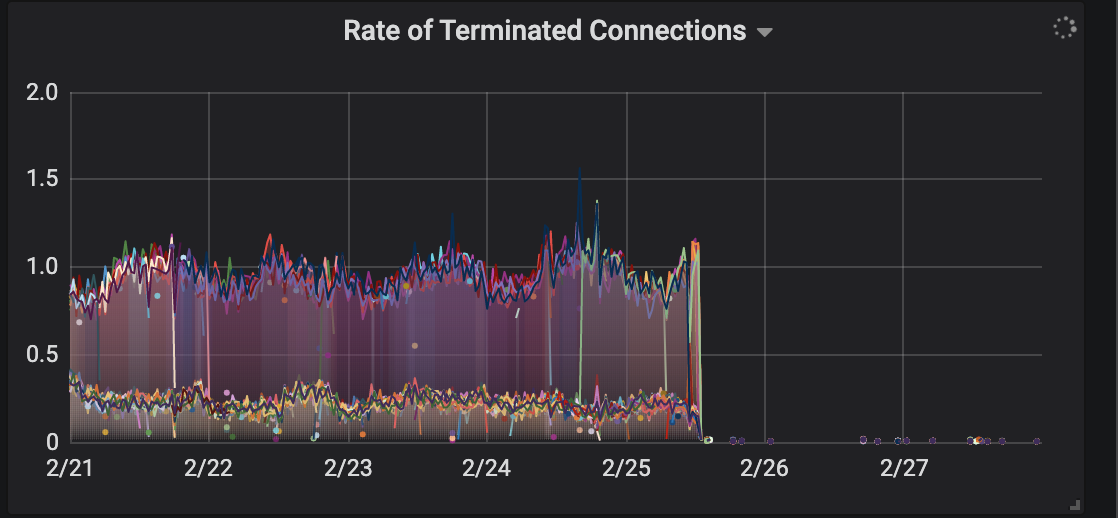
weave_connection_terminations_total
weave_connections
weave_flows
weave_ipam_pending_allocates
weave_ipam_pending_claims
weave_ipam_unreachable_count
weave_ipam_unreachable_percentage
Get Dashboard✕
Download
Copy to Clipboard