VMWare Vsphere - VM Dashboard -via vsphere-graphite 1,2511,251
3/15/2019
3/16/2019
1
Host Metrics
>=6.0.0
Prometheus
Description
Prometheus data source - dashboard for guest VM based on cblomart/vsphere-graphite for VMware Vsphere.
Screenshots
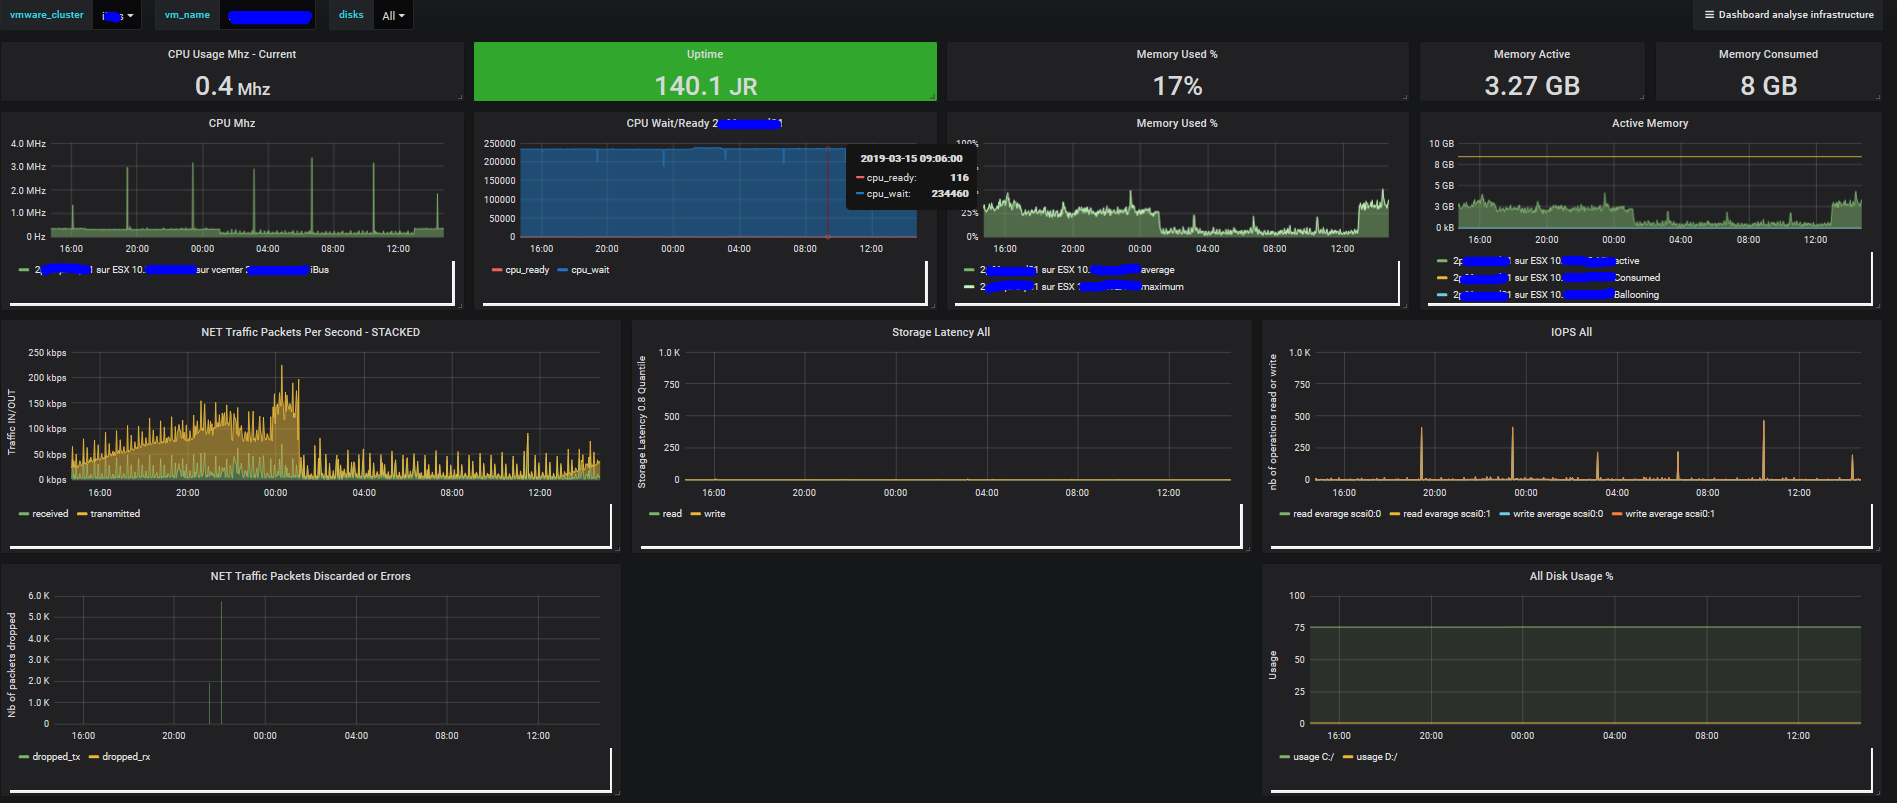
Used Metrics 2020
quantile
vsphere_cpu_ready_summation
vsphere_cpu_usagemhz_maximum
vsphere_cpu_wait_summation
vsphere_guestdisk_usage_latest
vsphere_mem_active_maximum
vsphere_mem_consumed_maximum
vsphere_mem_sizemb_latest
vsphere_mem_usage_average
vsphere_mem_usage_maximum
vsphere_mem_vmmemctl_maximum
vsphere_net_droppedrx_summation
vsphere_net_droppedtx_summation
vsphere_net_received_average
vsphere_net_transmitted_average
vsphere_sys_uptime_latest
vsphere_virtualdisk_numberreadaveraged_average
vsphere_virtualdisk_numberwriteaveraged_average
vsphere_virtualdisk_totalreadlatency_average
vsphere_virtualdisk_totalwritelatency_average
Get Dashboard✕
Download
Copy to Clipboard