Victoria Metrics cluster - IG1 version 30,45330,453
2/28/2020
3/9/2020
6
>=6.6.2
Prometheus
Description
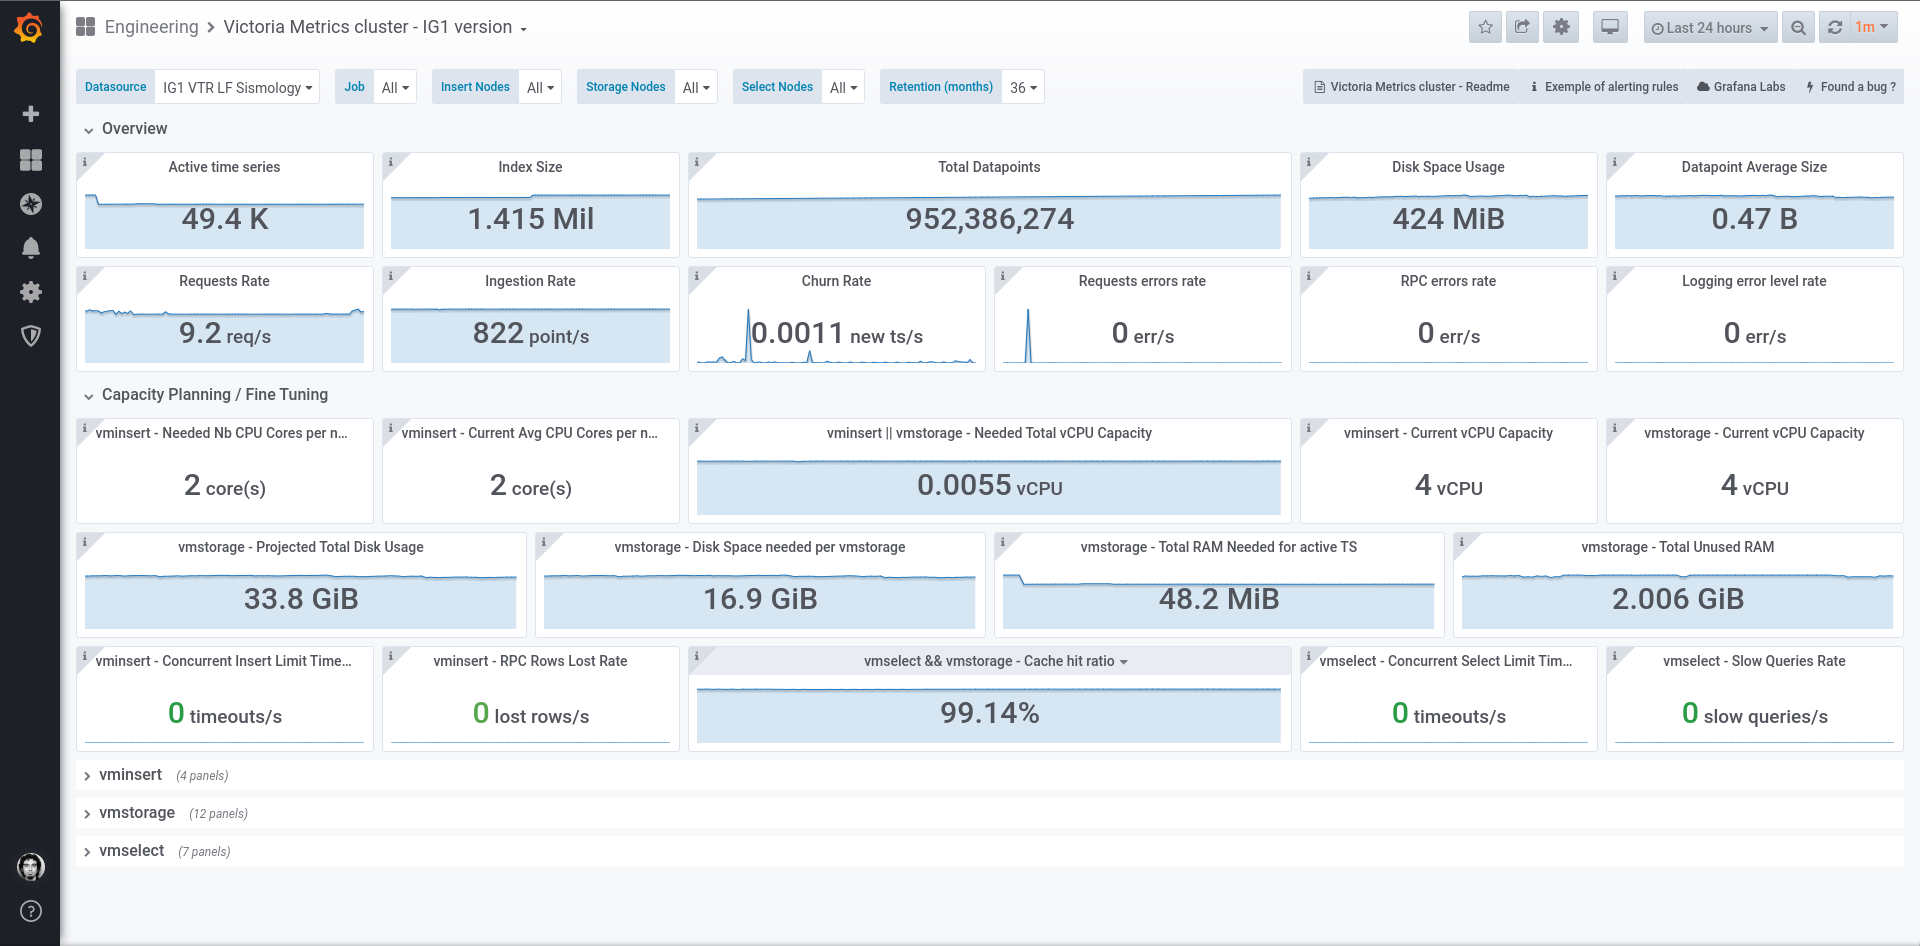
An alternate version of the Victoria Metrics cluster dashboard for VM cluster v1.34.0 or higher
Screenshots
Used Metrics 2929
go_cpu_count
insertNodes
nodes
nodesWithCache
retention
storageNodes
vm_allowed_memory_bytes
vm_app_version
vm_cache_entries
vm_cache_misses_total
vm_cache_requests_total
vm_cache_size_bytes
vm_concurrent_insert_limit_timeout_total
vm_concurrent_select_limit_timeout_total
vm_data_size_bytes
vm_deduplicated_samples_total
vm_http_request_errors_total
vm_http_requests_total
vm_log_messages_total
vm_new_timeseries_created_total
vm_rows
vm_rows_inserted_total
vm_rpc_connection_errors_total
vm_rpc_dial_errors_total
vm_rpc_handshake_errors_total
vm_rpc_reroute_errors_total
vm_rpc_rows_lost_total
vm_slow_queries_total
with
Get Dashboard✕
Download
Copy to Clipboard