Vertica Resource Management (Prometheus) 3,0233,023
Description
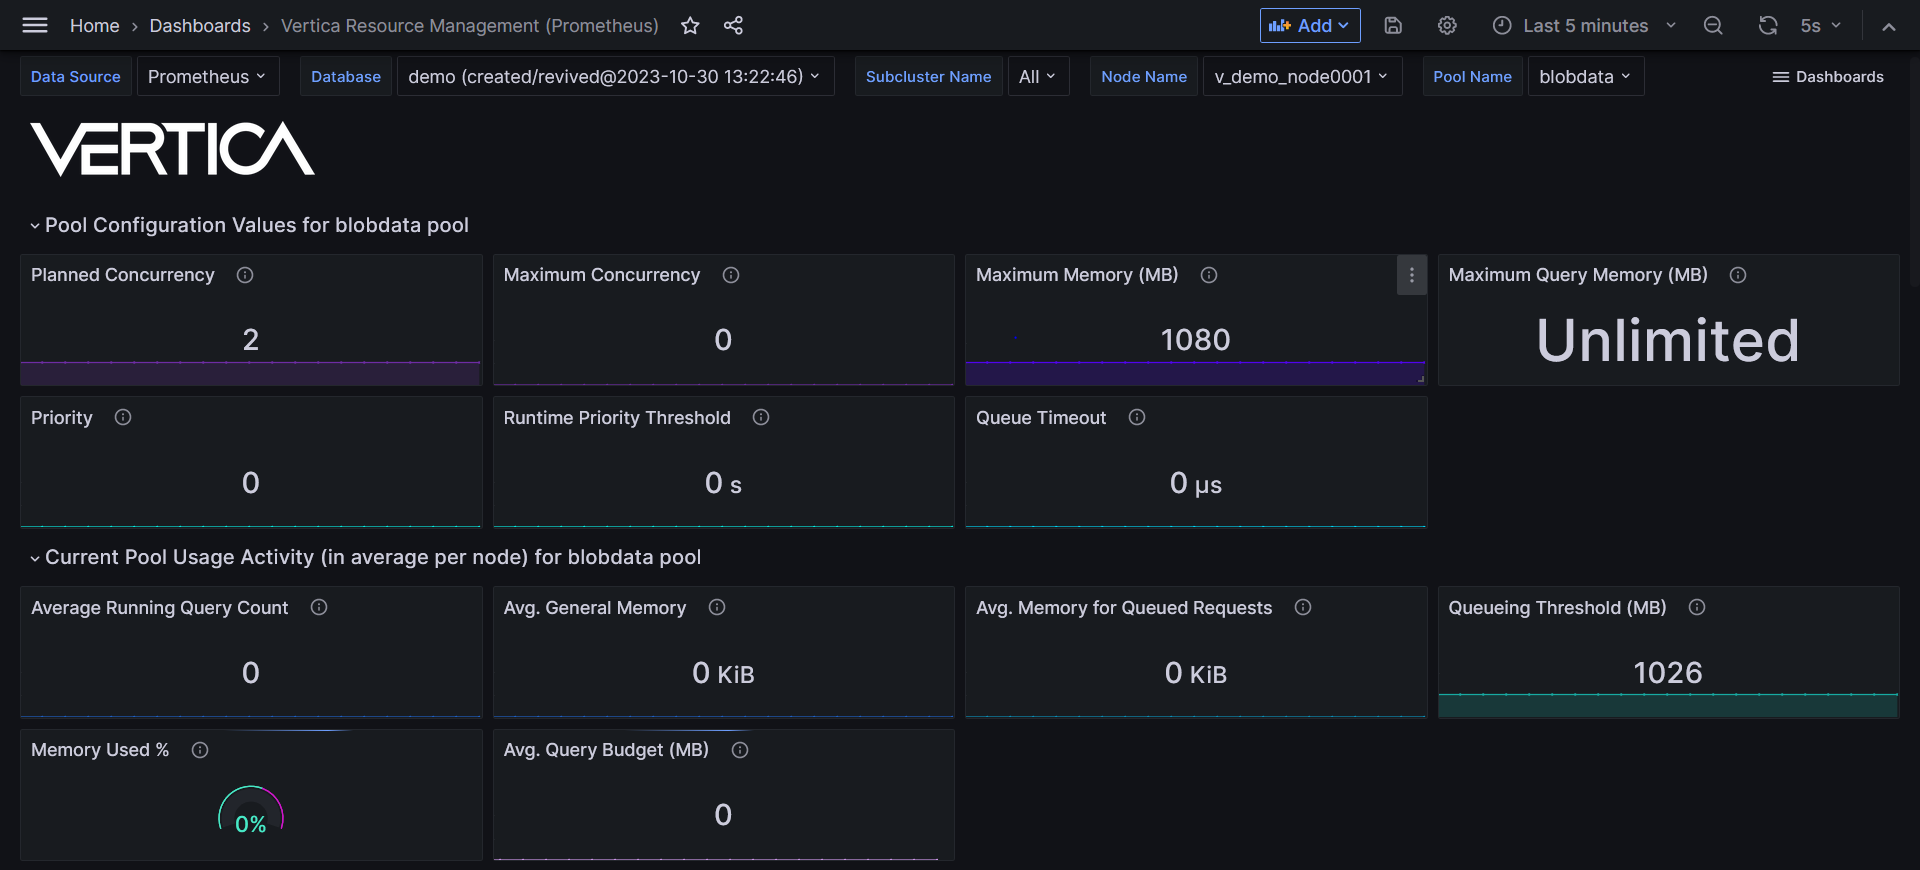
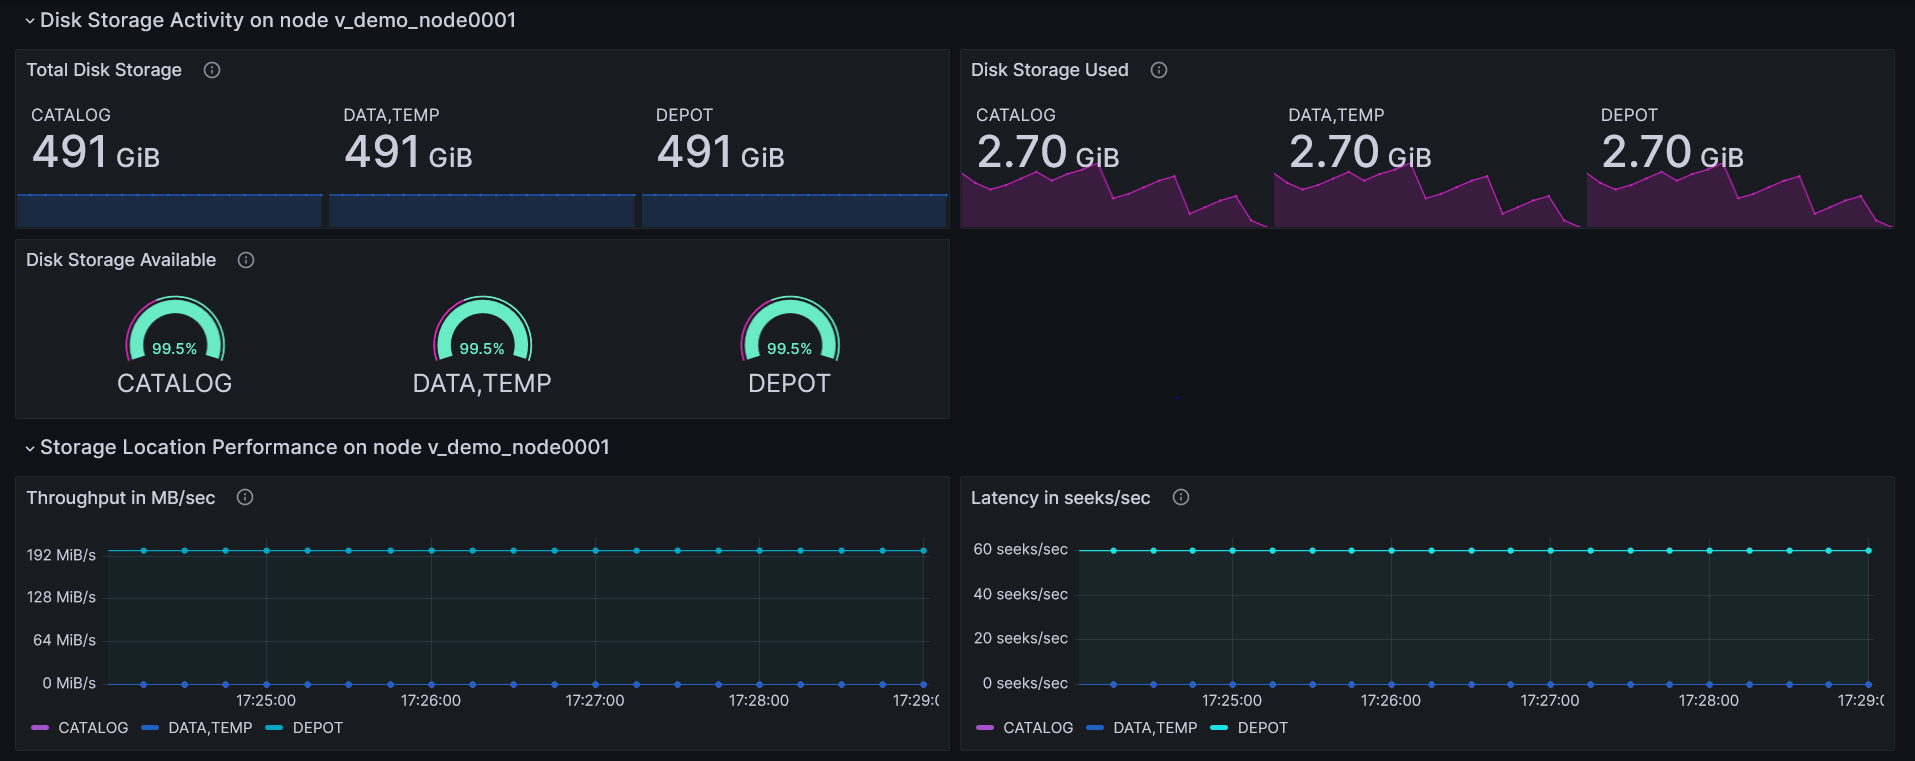
Monitors resource pool usage.
Screenshots
Used Metrics 2323
vertica_disk_storage_free_percent
vertica_disk_storage_latency_seek_per_second
vertica_disk_storage_throughput_mb_per_second
vertica_disk_storage_total_mb
vertica_disk_storage_used_mb
vertica_query_requests_time_ms_count
vertica_query_requests_time_ms_sum
vertica_queued_requests_total
vertica_queued_requests_total_memory_kb
vertica_resource_pool_general_memory_borrowed_kb
vertica_resource_pool_max_concurrency
vertica_resource_pool_max_memory_size_kb
vertica_resource_pool_max_query_memory_size_kb
vertica_resource_pool_memory_inuse_kb
vertica_resource_pool_memory_size_actual_kb
vertica_resource_pool_planned_concurrency
vertica_resource_pool_priority
vertica_resource_pool_query_budget_kb
vertica_resource_pool_queue_timeout
vertica_resource_pool_queueing_threshold_kb
vertica_resource_pool_running_query_count
vertica_resource_pool_runtime_priority_threshold
vertica_resource_rejections_total