Vertica Queries (Prometheus) 2,8992,899
11/6/2023
11/10/2023
1
>=9.5.1
Description
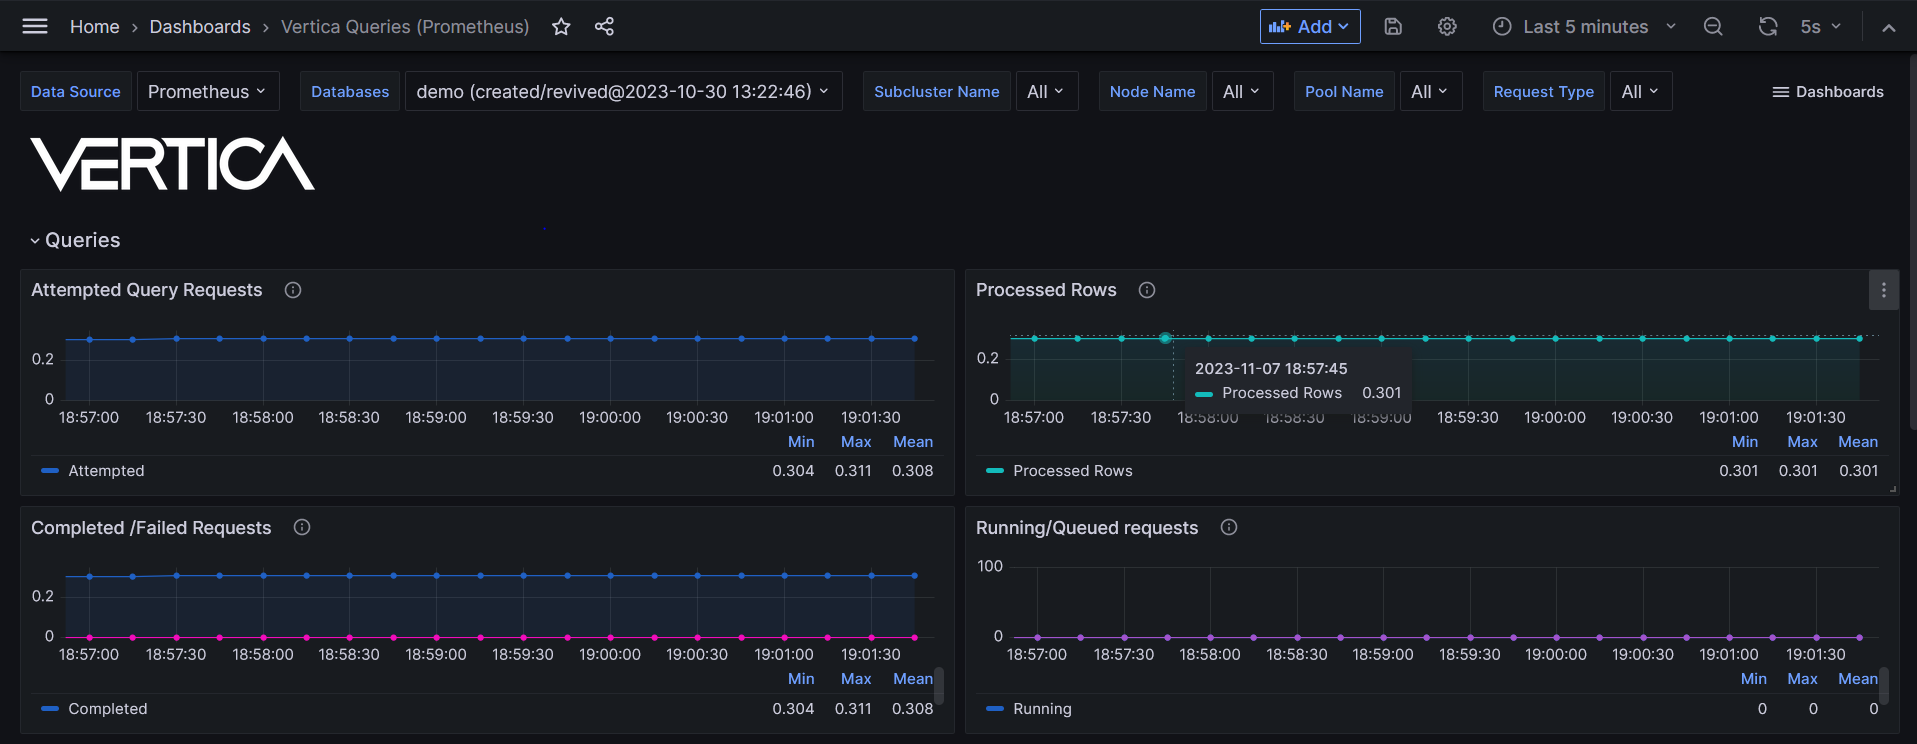
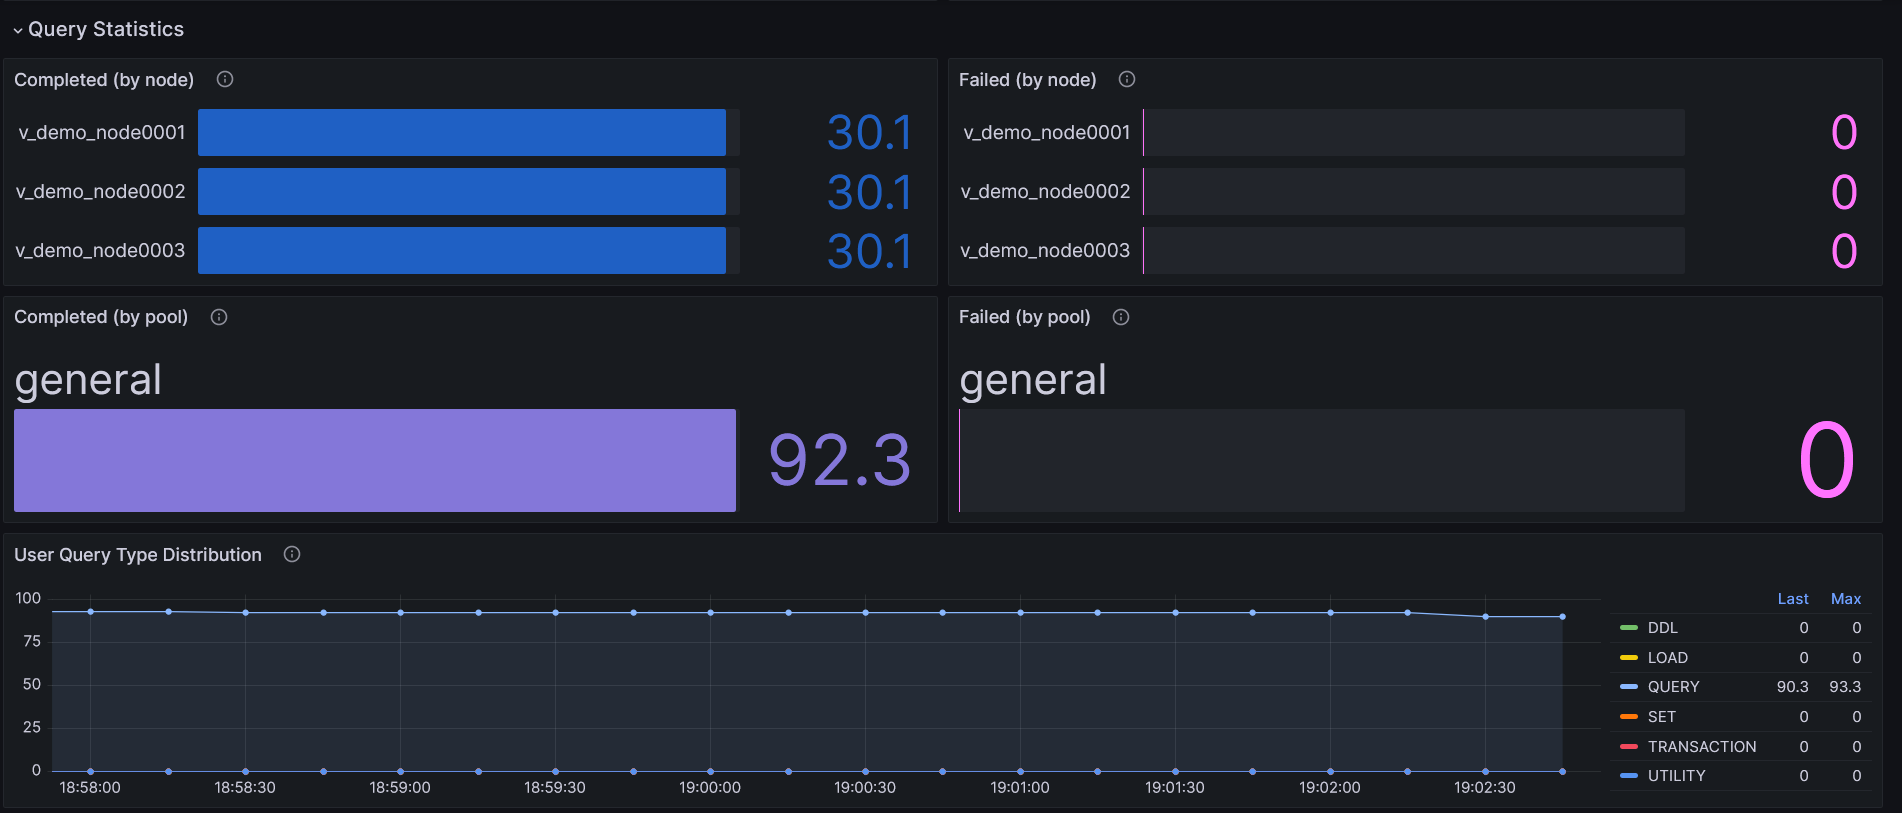
Monitors queries in a cluster.
Screenshots
Used Metrics 99
vertica_query_requests_attempted_total
vertica_query_requests_failed_total
vertica_query_requests_processed_rows_total
vertica_query_requests_succeeded_total
vertica_query_requests_time_ms_bucket
vertica_query_requests_time_ms_count
vertica_query_requests_time_ms_sum
vertica_queued_requests_total
vertica_resource_pool_running_query_count
Get Dashboard✕
Download
Copy to Clipboard