Vertica Overview (Prometheus) 3,0703,070
11/6/2023
11/10/2023
1
Databases
>=9.5.1
Description
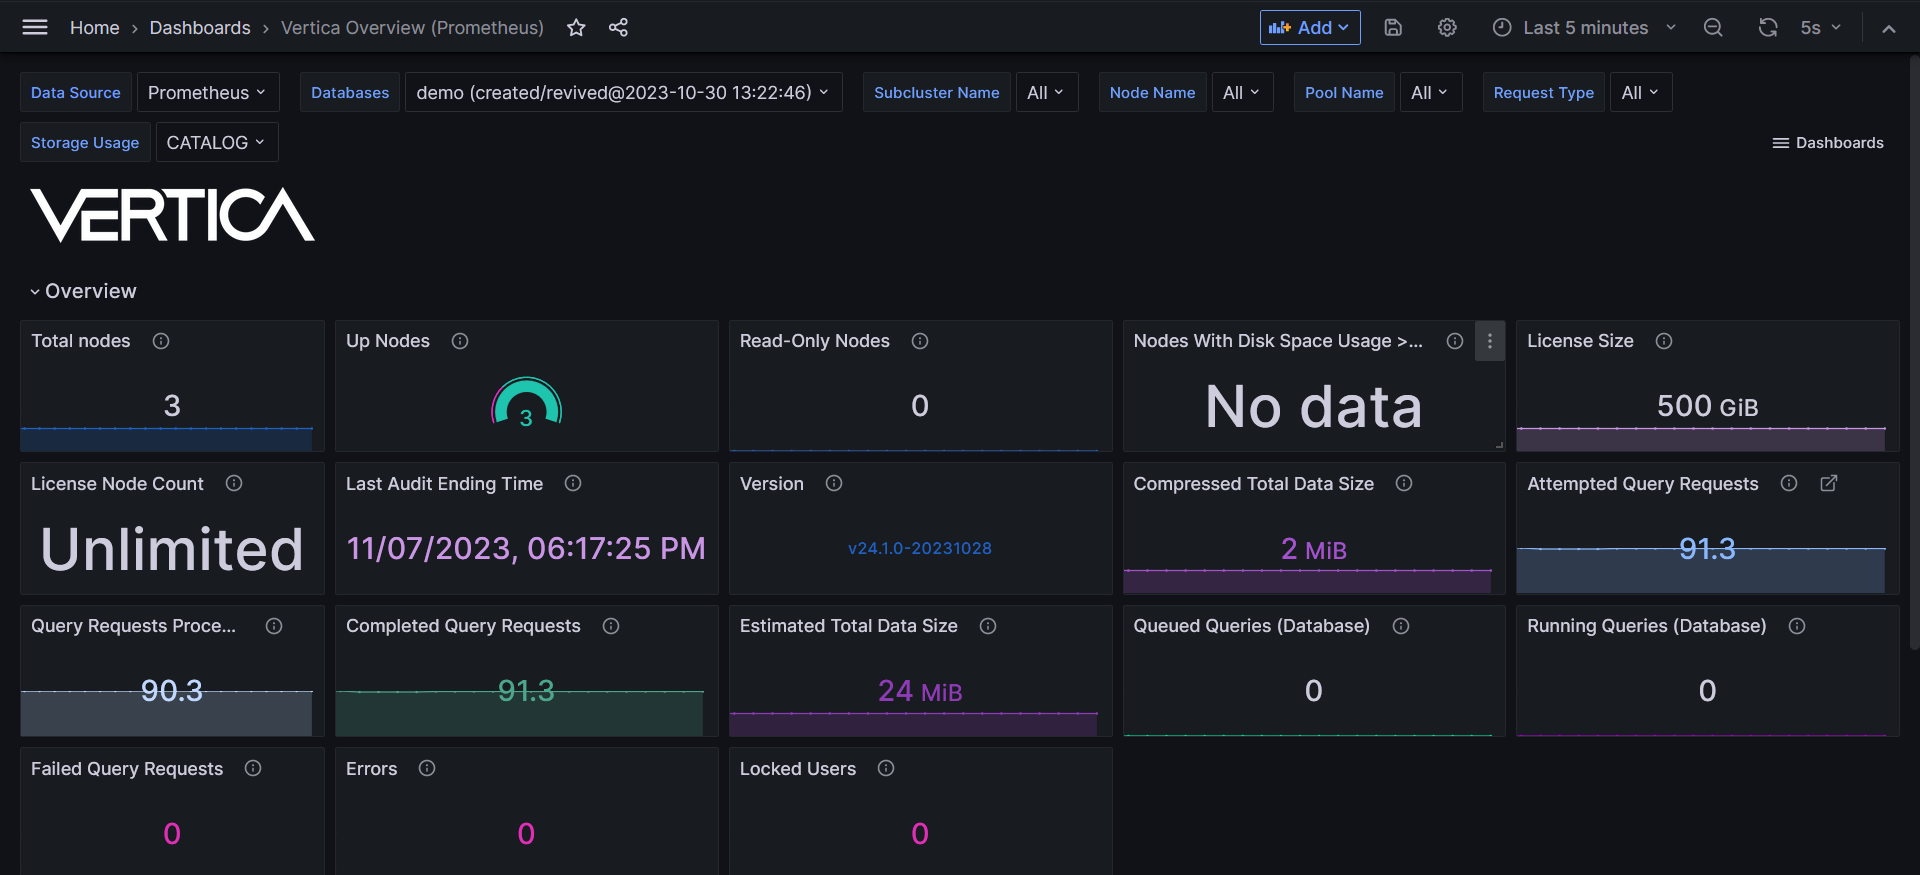
General cluster overview.
Screenshots
Used Metrics 1818
vertica_build_info
vertica_data_size_compressed_mb
vertica_disk_storage_free_percent
vertica_errors
vertica_estimated_data_size_raw_mb
vertica_is_readonly
vertica_last_audit_end_time
vertica_license_node_count
vertica_license_size_mb
vertica_locked_users
vertica_query_requests_attempted_total
vertica_query_requests_failed_total
vertica_query_requests_processed_rows_total
vertica_query_requests_succeeded_total
vertica_queued_requests_total
vertica_resource_pool_running_query_count
vertica_total_nodes_count
vertica_up_nodes_count
Get Dashboard✕
Download
Copy to Clipboard