Vertica Depot (Prometheus) 3,0023,002
11/6/2023
11/10/2023
1
>=9.5.1
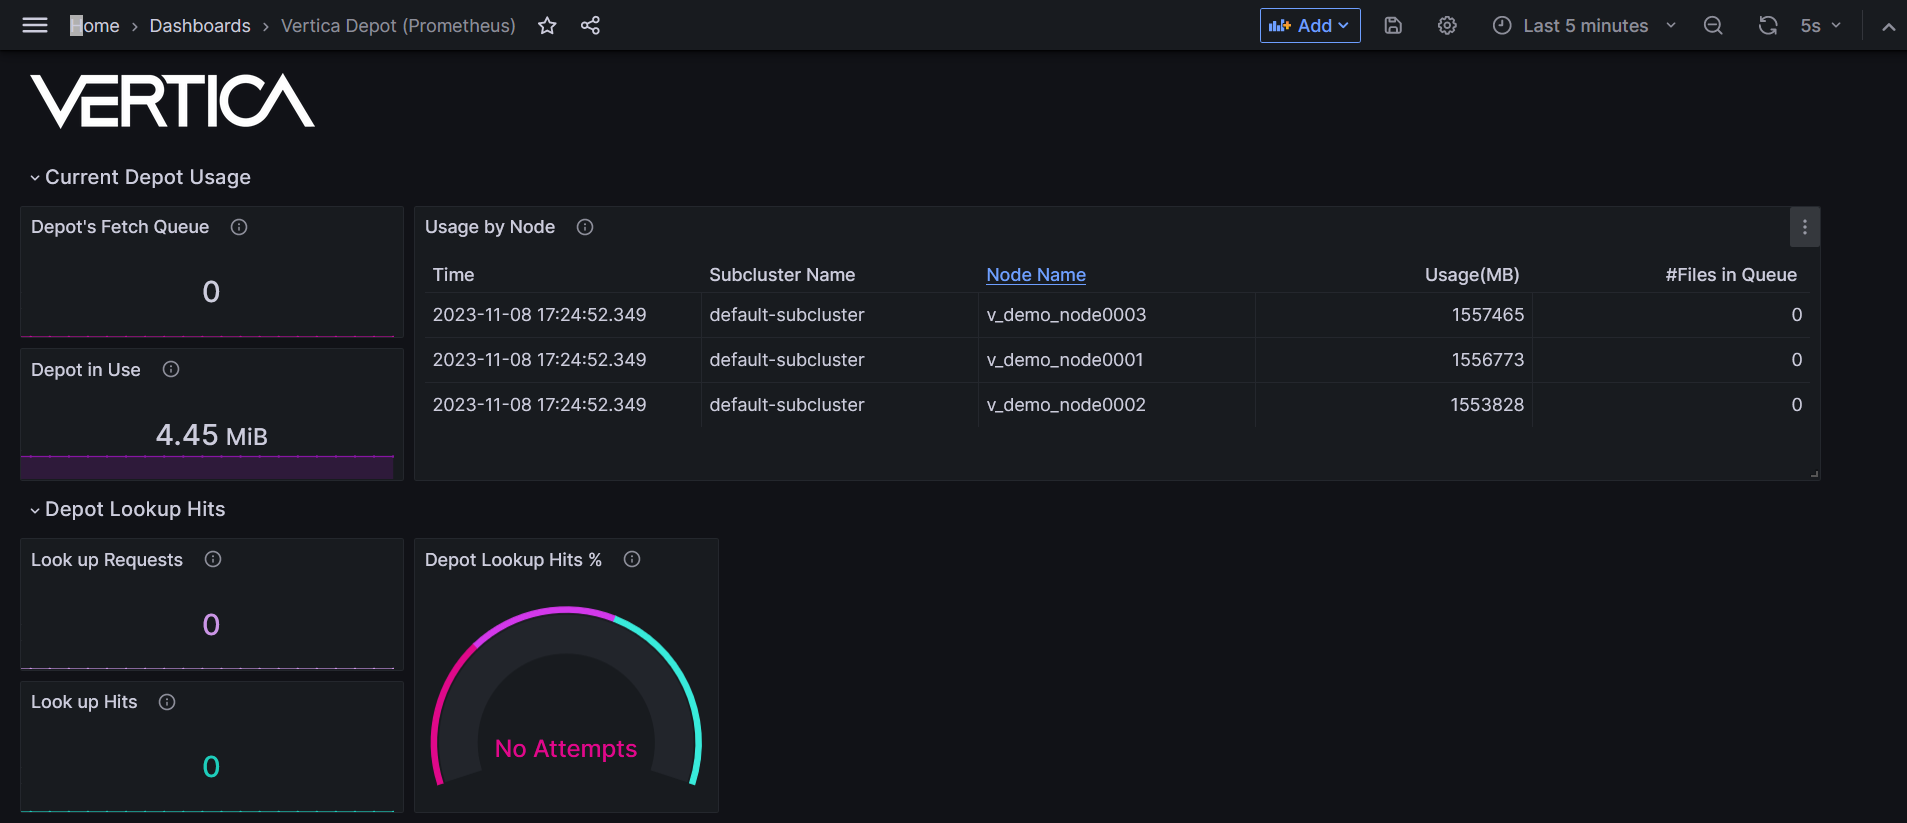
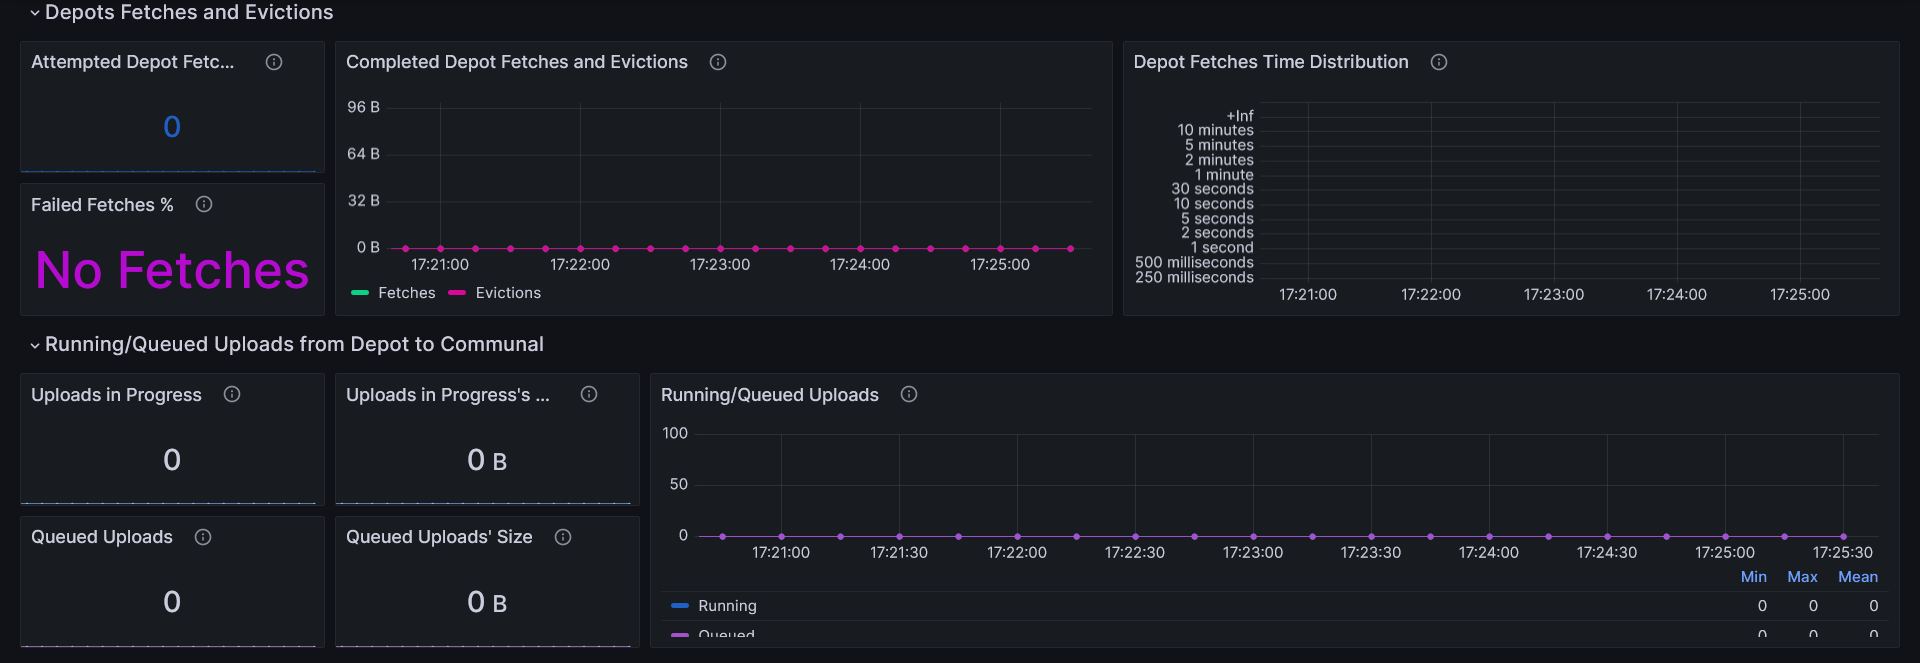
Description
Monitors database depot usage.
Screenshots
Used Metrics 1818
vertica_depot_evictions_bytes
vertica_depot_fetch_queue_size
vertica_depot_fetches_bytes
vertica_depot_fetches_failures_total
vertica_depot_fetches_ms_bucket
vertica_depot_fetches_requests_total
vertica_depot_lookup_hits_total
vertica_depot_lookup_requests_total
vertica_depot_size_bytes
vertica_depot_uploads_bytes
vertica_depot_uploads_failures_total
vertica_depot_uploads_in_progress_bytes
vertica_depot_uploads_in_progress_counter
vertica_depot_uploads_ms_sum
vertica_depot_uploads_queued_bytes
vertica_depot_uploads_queued_counter
vertica_depot_uploads_requests_total
vertica_subcluster_info
Get Dashboard✕
Download
Copy to Clipboard