Vault Sync Operator Dashboard 49,14249,142
Description
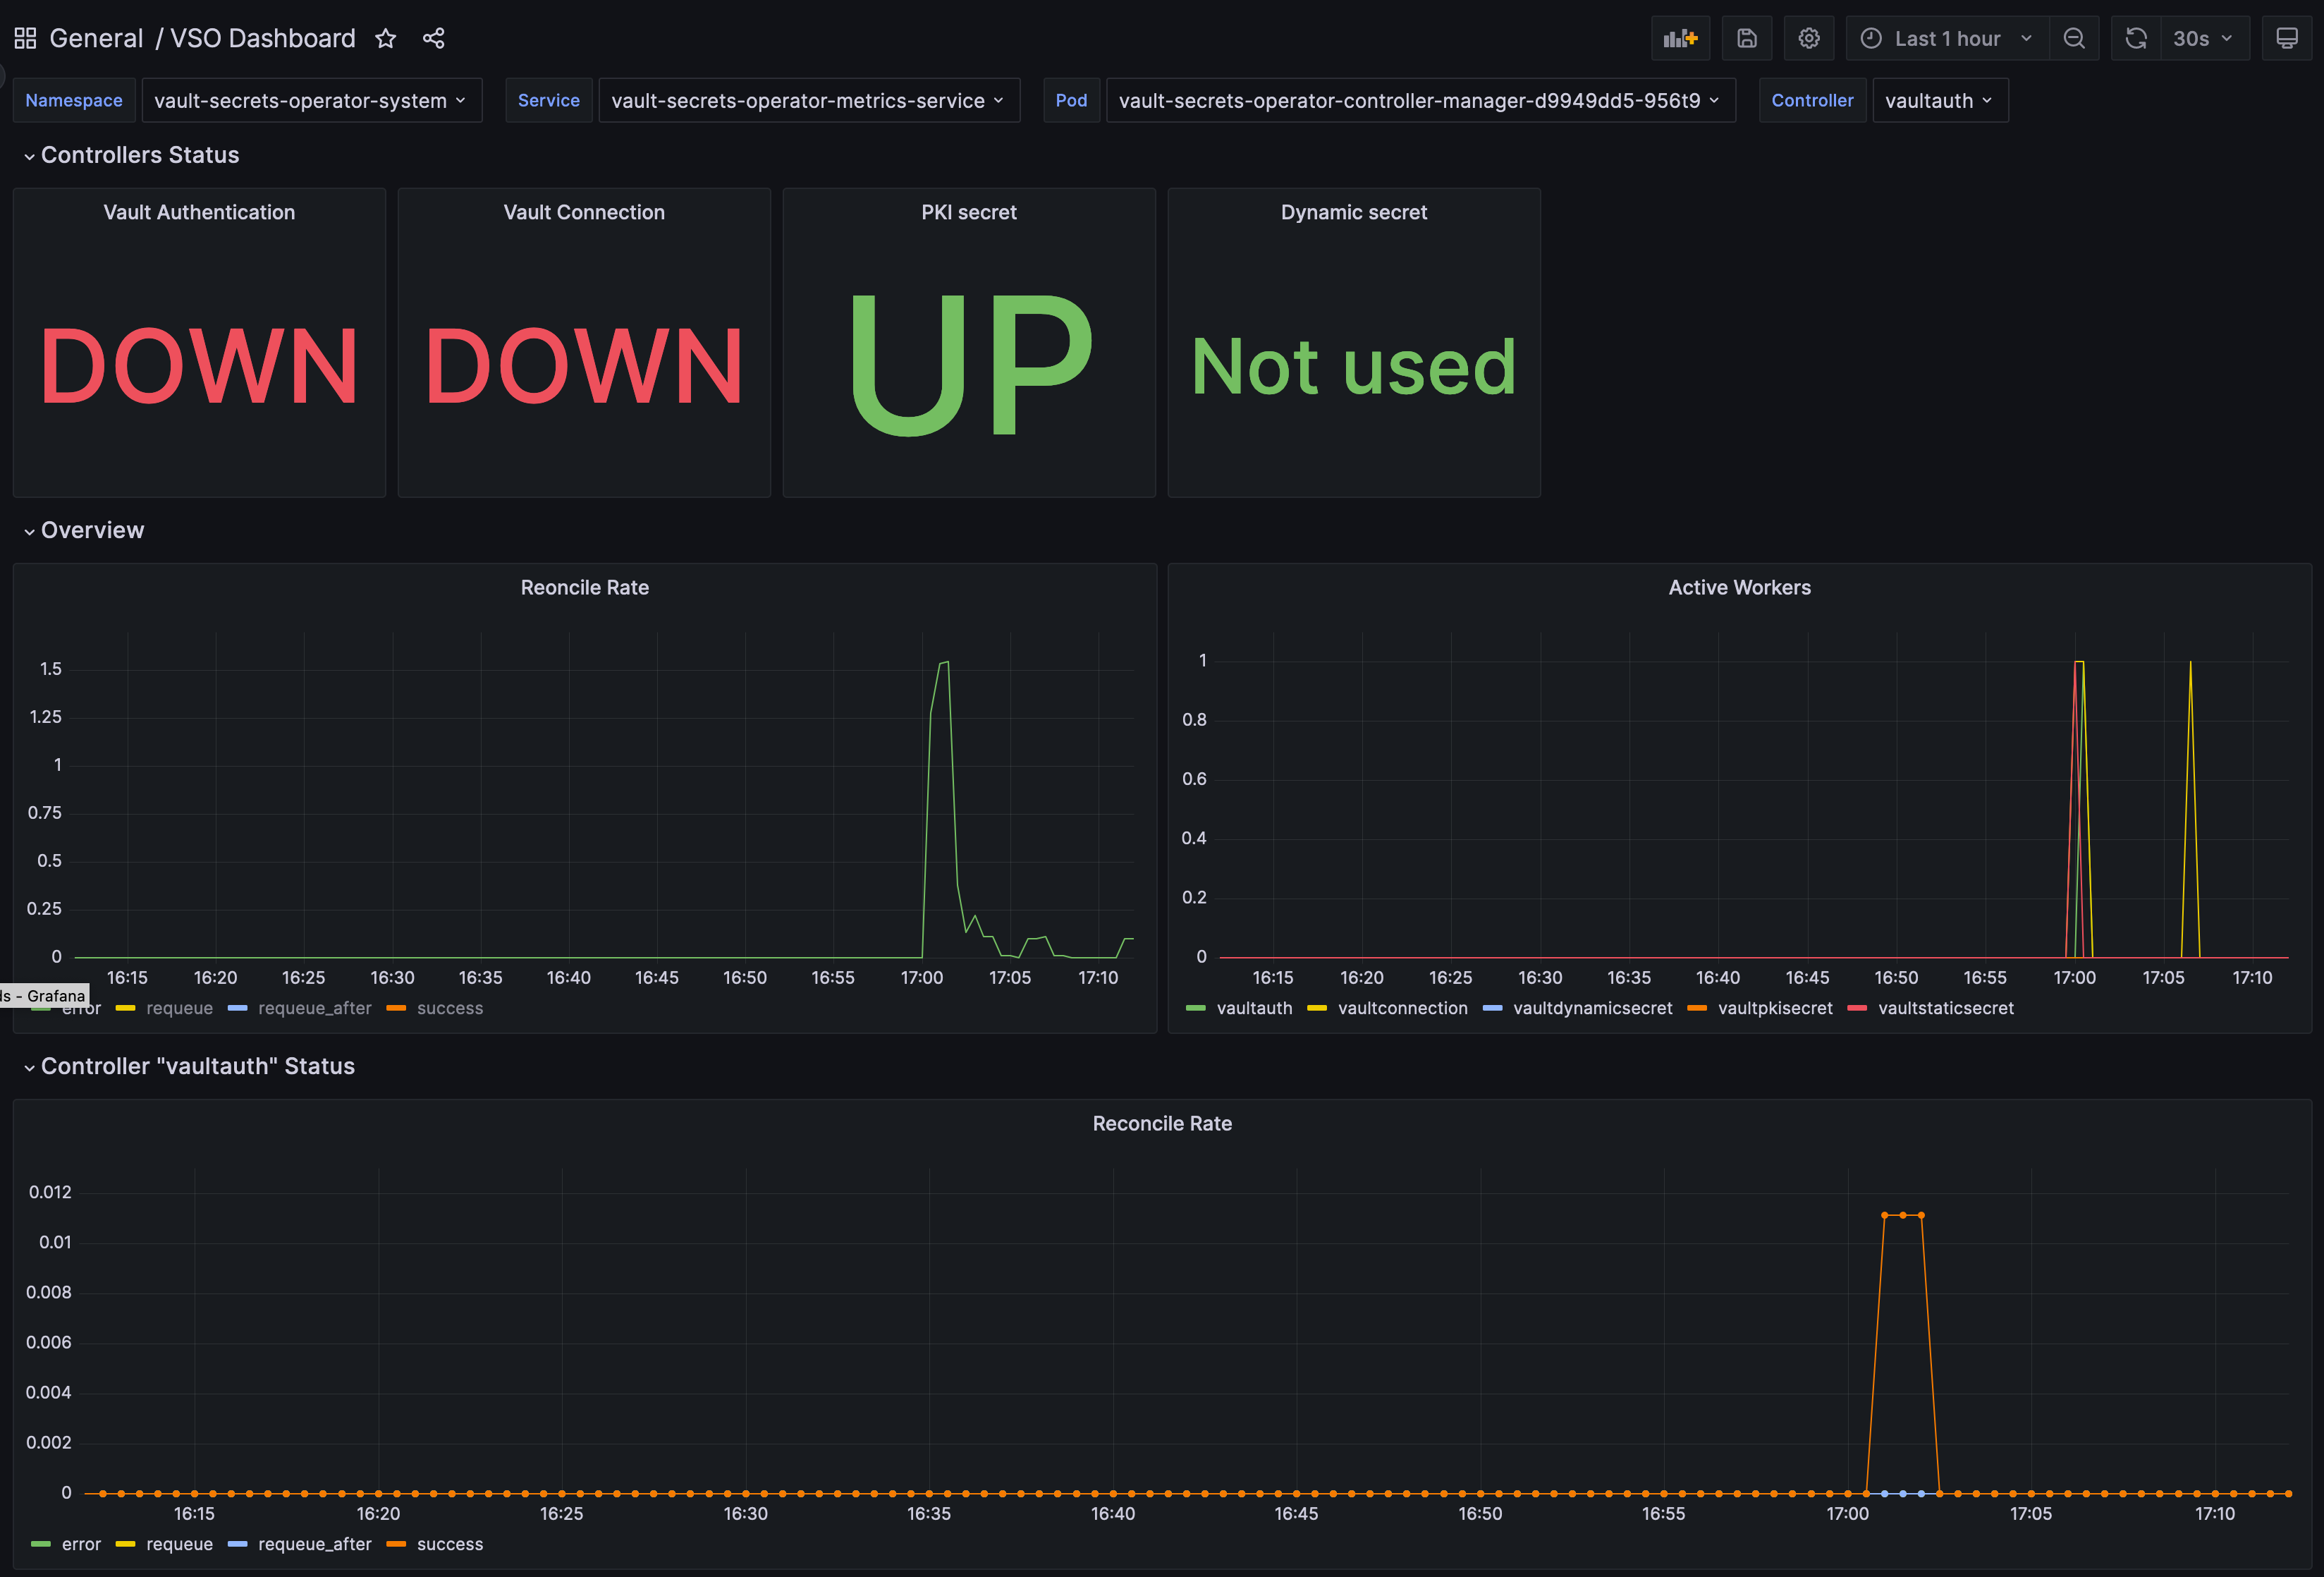
This dashboard monitors the health and performance of the Vault Sync Operator, visualizing authentication status, connection health, and PKI/dynamic secret handling across the operator lifecycle. It emphasizes reconciliation metrics such as controller_runtime_reconcile_total and controller_runtime_reconcile_time_seconds_bucket to highlight throughput and latency, while also surfacing active workers via controller_runtime_active_workers to indicate concurrency and processing capacity. Other panels like Reoncile Rate, Reconcile Time Buckets, and Vault Connection offer a concise view of operational bottlenecks and secret management effectiveness.
Screenshots
Used Metrics 44
controller_resource_status
controller_runtime_active_workers
controller_runtime_reconcile_time_seconds_bucket
controller_runtime_reconcile_total