Varnish 6,7096,709 5.0 (1 reviews)
3/11/2019
3/11/2019
1
Docker
>=3.1.1
Prometheus
Description
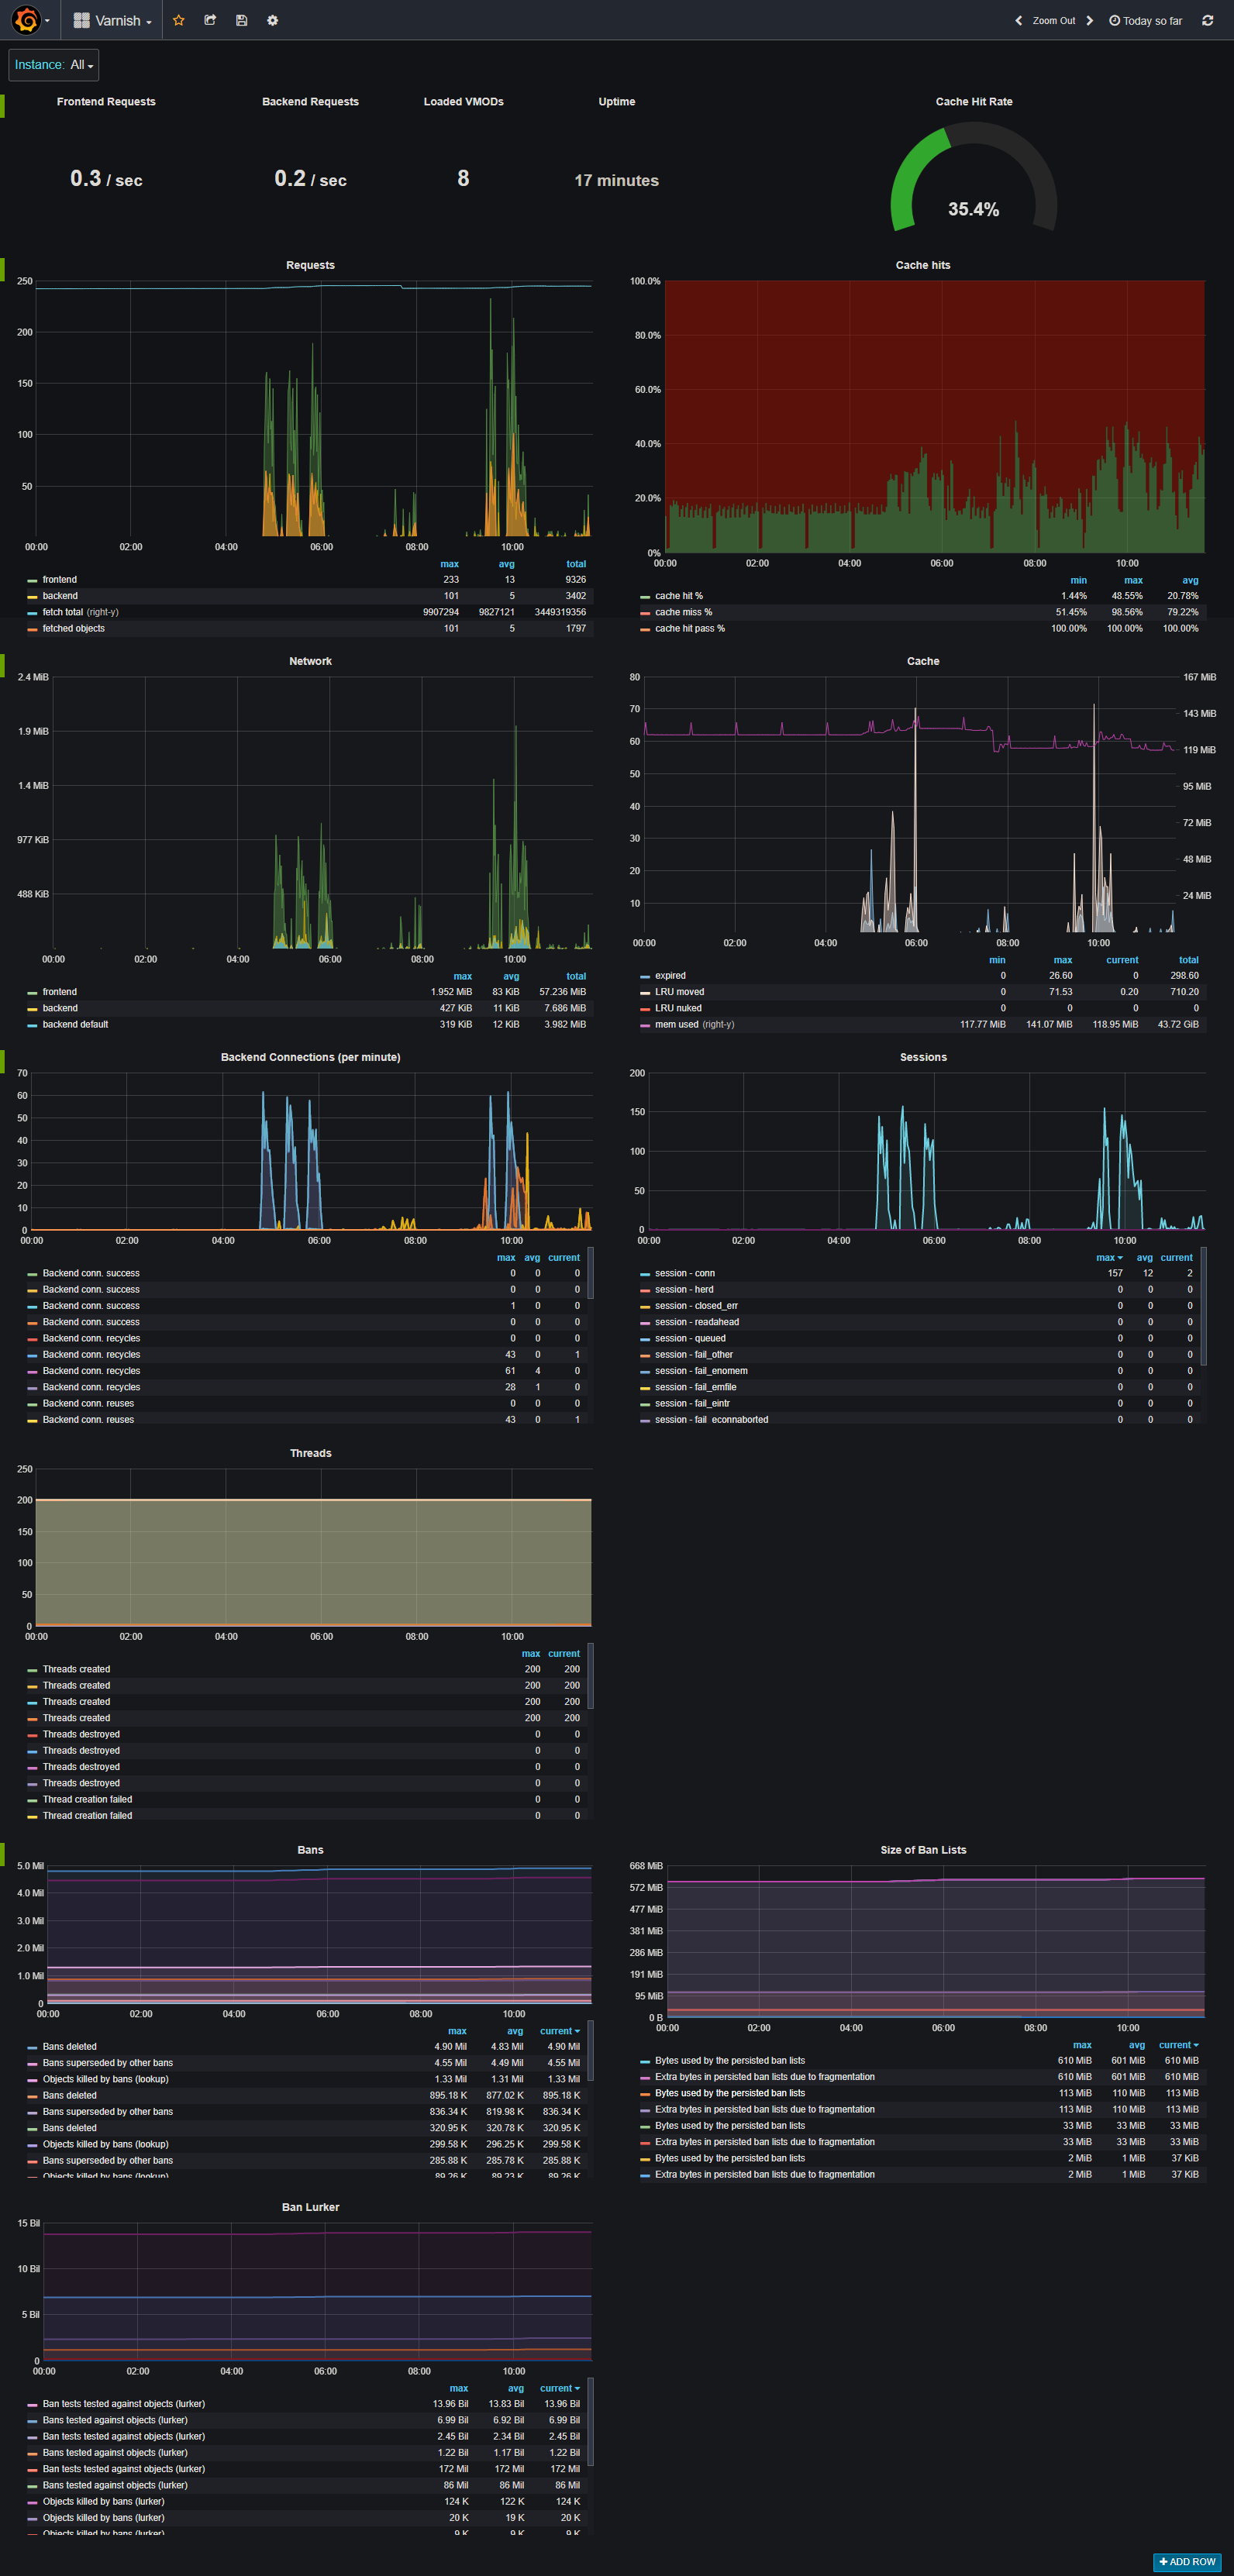
A dashboard to use to debug a running varnish instance. Easily track requests, cache hits, network i/o, sessions, threads, bans, ban lurker and the ban list size
Screenshots

Get Dashboard✕
Download
Copy to Clipboard