uptimerobot 2,3612,361
5/27/2018
6/15/2018
2
>=5.1.3
Prometheus
Description
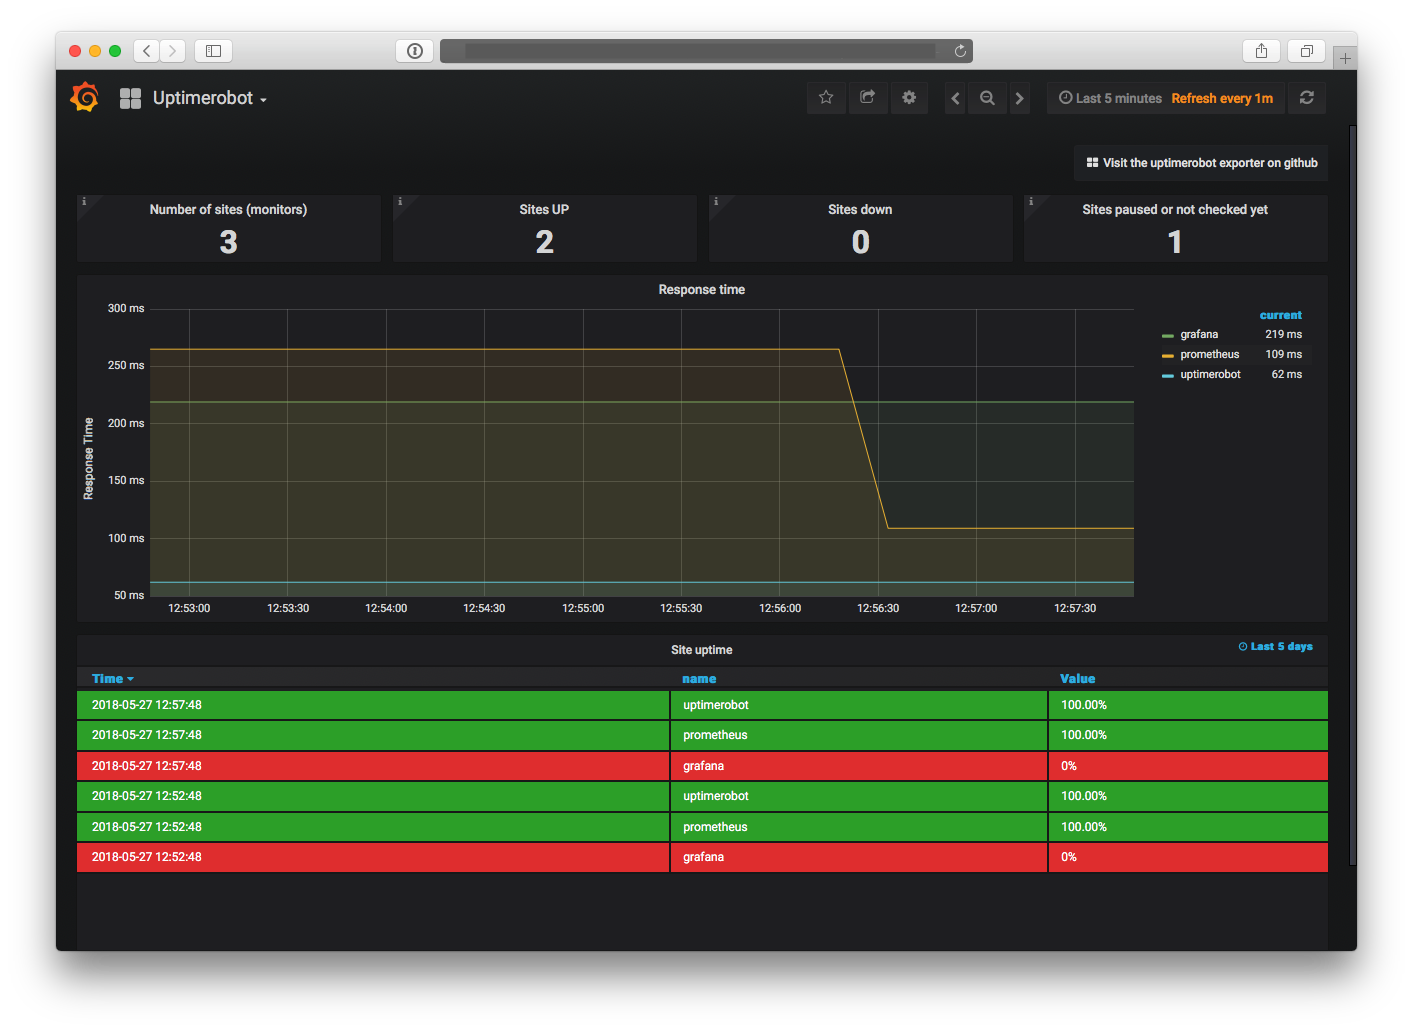
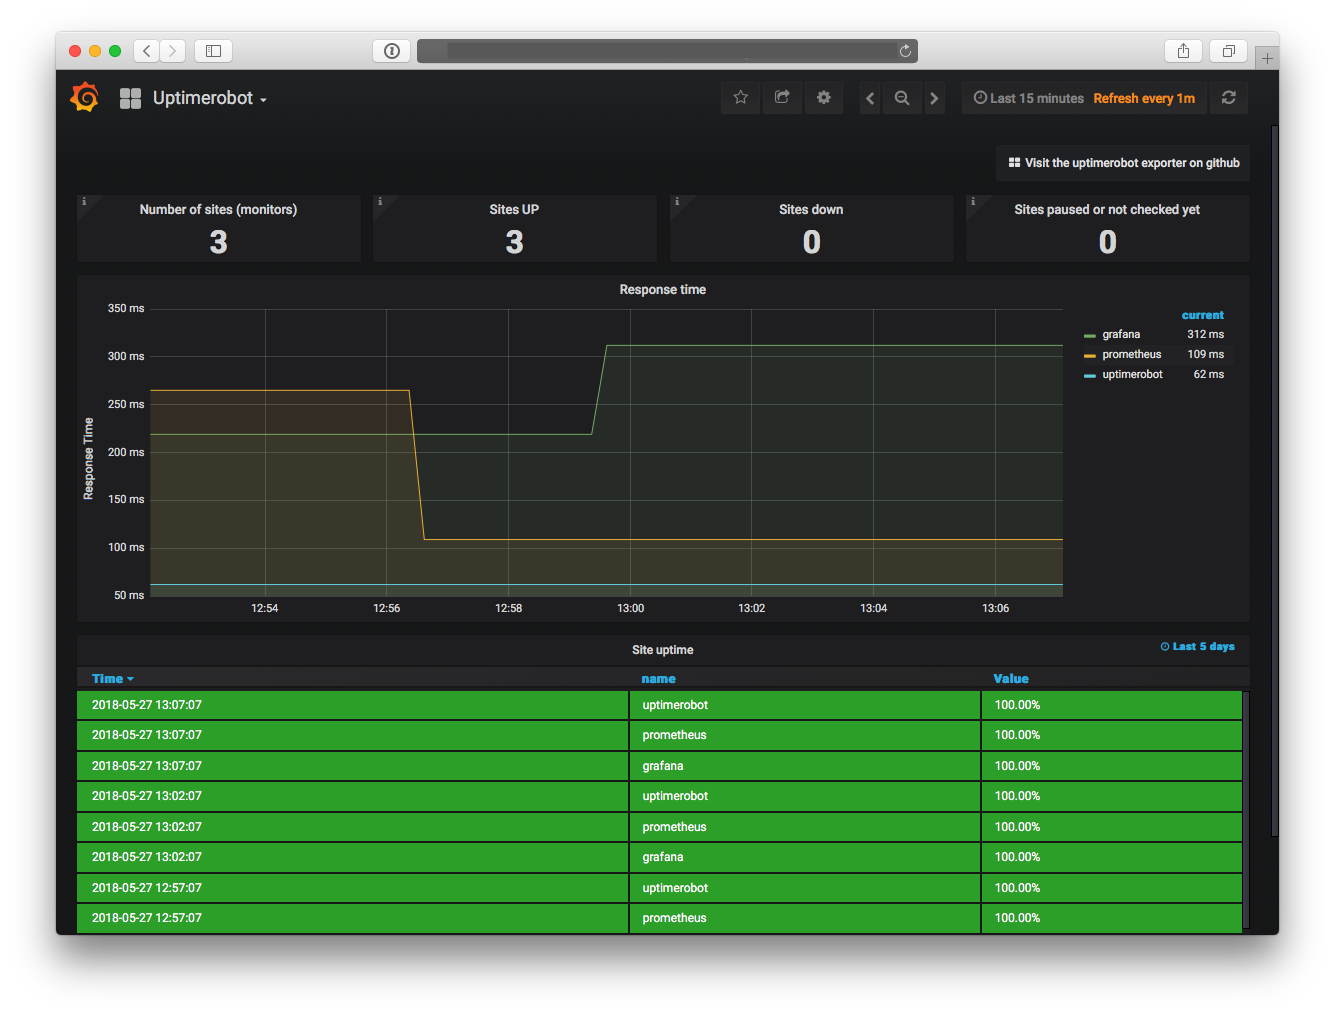
Dashboard for prometheus uptimerobot exporter
Screenshots
Used Metrics 44
uptimerobot_monitor_responsetime
uptimerobot_monitor_ssl
uptimerobot_monitor_status
uptimerobot_monitor_up
Get Dashboard✕
Download
Copy to Clipboard