Unpackerr 47,75647,756
Description
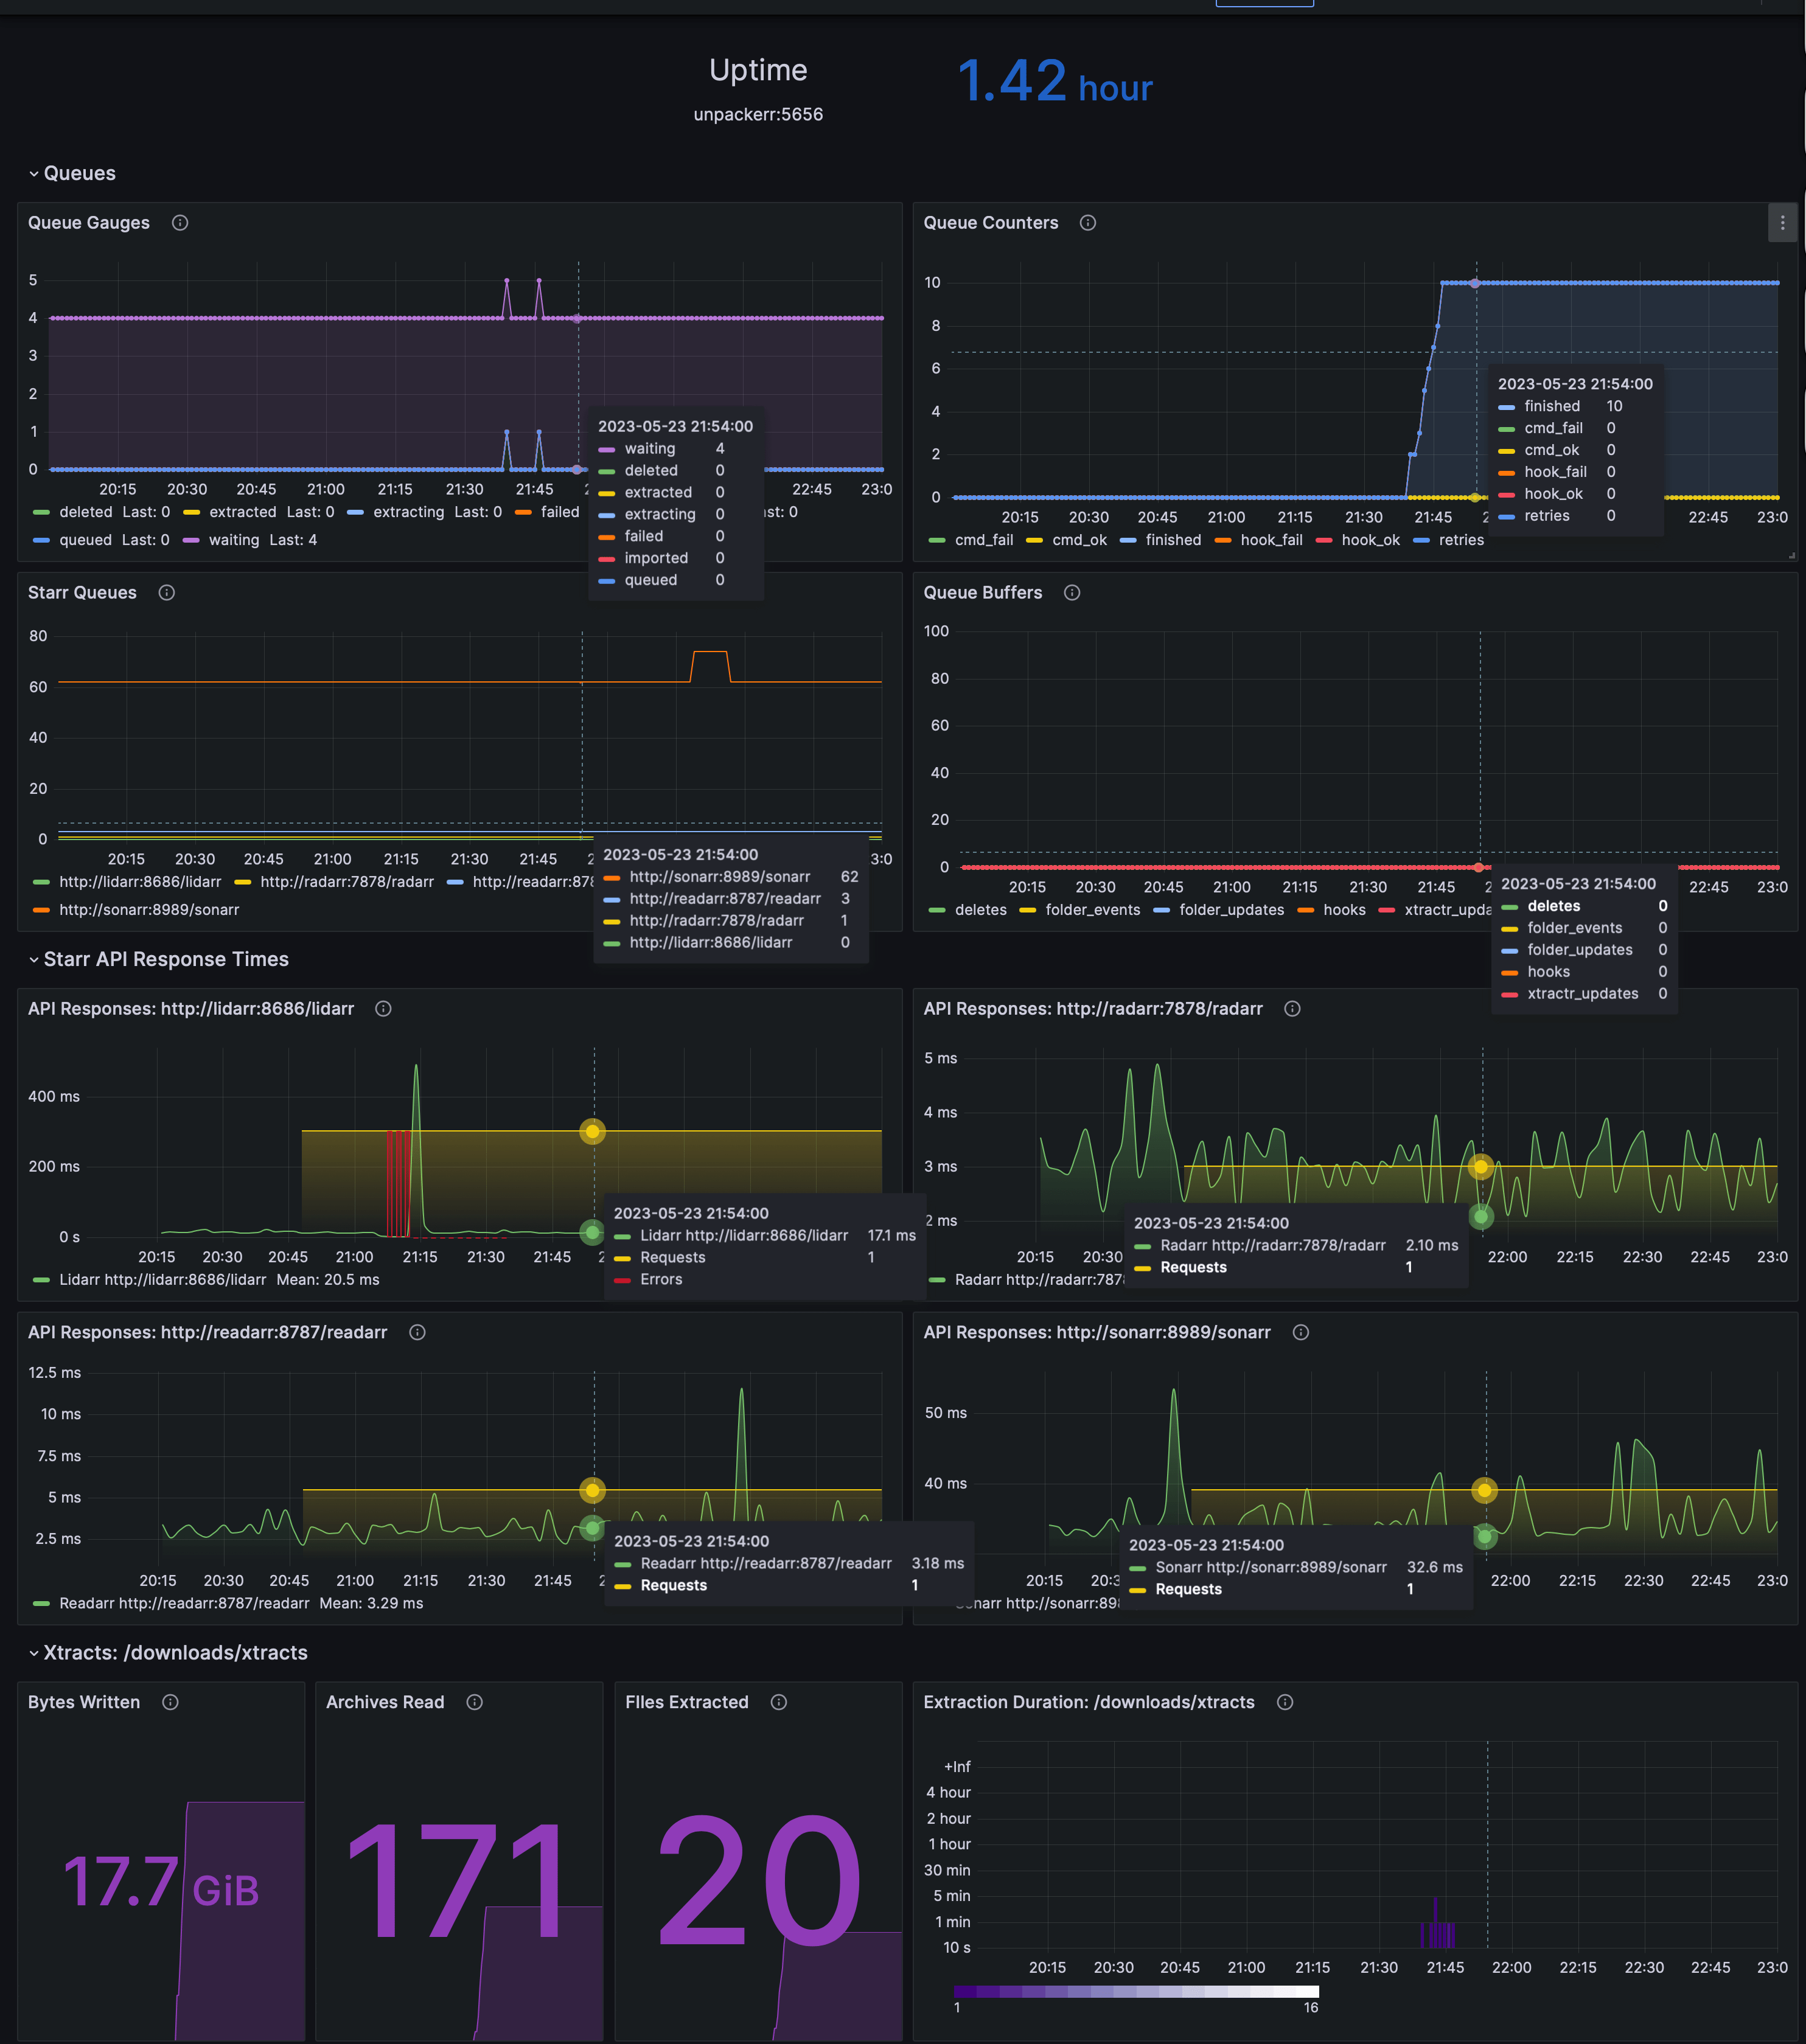
This dashboard provides a real-time health and performance view for an unpacking workflow, tracking uptime and cross-component activity. It highlights queue dynamics and I/O behavior with key panels around unpackerr_app_queue_size, unpackerr_buffers, and unpackerr_bytes_written_total, plus archival and extraction timing metrics to surface bottlenecks. Notable features include per-instance uptime, fetch latency and throughput via unpackerr_app_queue_fetch_time_seconds and unpackerr_app_queue_fetch_total, and aggregate counters for queue depth and errors to monitor reliability.
Screenshots
Used Metrics 1212
unpackerr_app_queue_fetch_errors_total
unpackerr_app_queue_fetch_time_seconds
unpackerr_app_queue_fetch_total
unpackerr_app_queue_size
unpackerr_archives_read_total
unpackerr_buffers
unpackerr_bytes_written_total
unpackerr_counters
unpackerr_extract_time_seconds_bucket
unpackerr_files_extracted_total
unpackerr_gauges
unpackerr_uptime_seconds_total