UniFi-Poller: USG Insights - Prometheus 411,798411,798
11/29/2019
1/1/2023
9
Host Metrics
>=7.0.3
Prometheus
Description
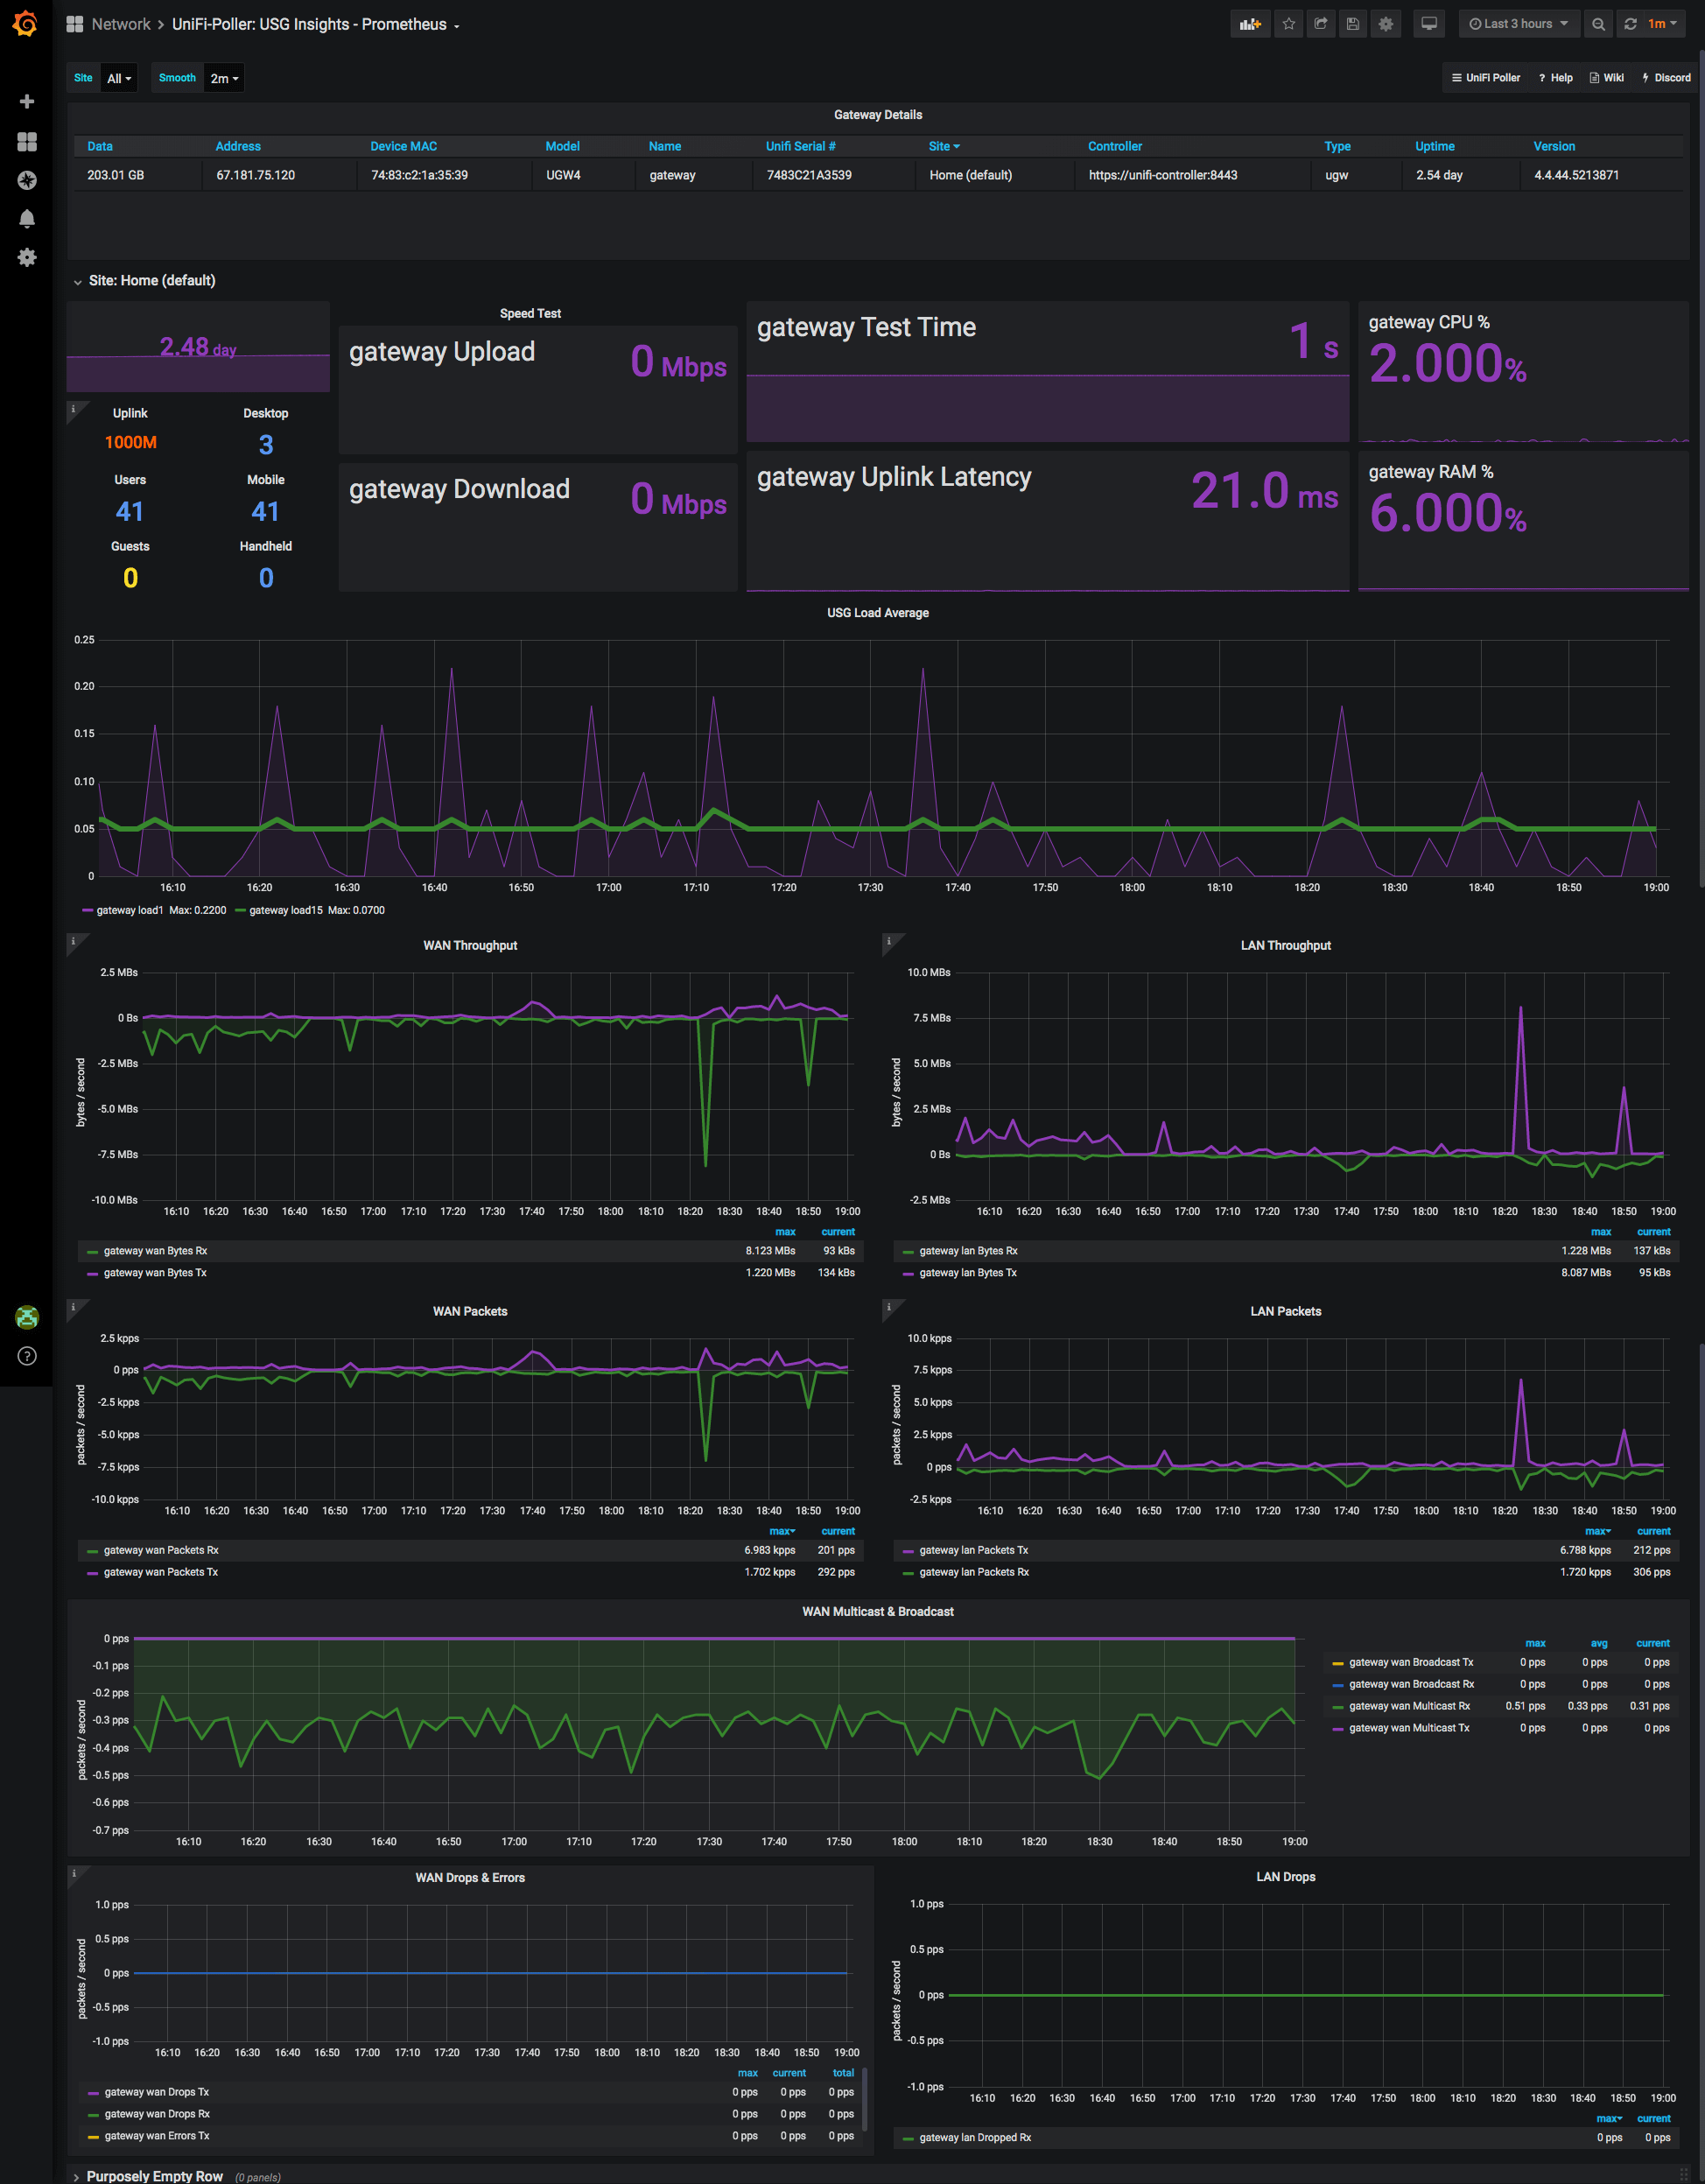
This dashboard monitors UniFi USG gateway health and performance by aggregating Prometheus metrics from the UniFi Poller. It highlights device info, uptime, and traffic stats to surface gateway reliability and throughput. Key metrics include unpoller_device_info, unpoller_device_uptime_seconds, and unpoller_device_bytes_total to provide identity, availability, and usage trends for each gateway.
Screenshots
Used Metrics 33
unpoller_device_bytes_total
unpoller_device_info
unpoller_device_uptime_seconds
Get Dashboard✕
Download
Copy to Clipboard