UniFi-Poller: Network Sites - Prometheus 514,494514,494
11/29/2019
1/1/2023
5
Host Metrics
>=6.6.0
Prometheus
Description
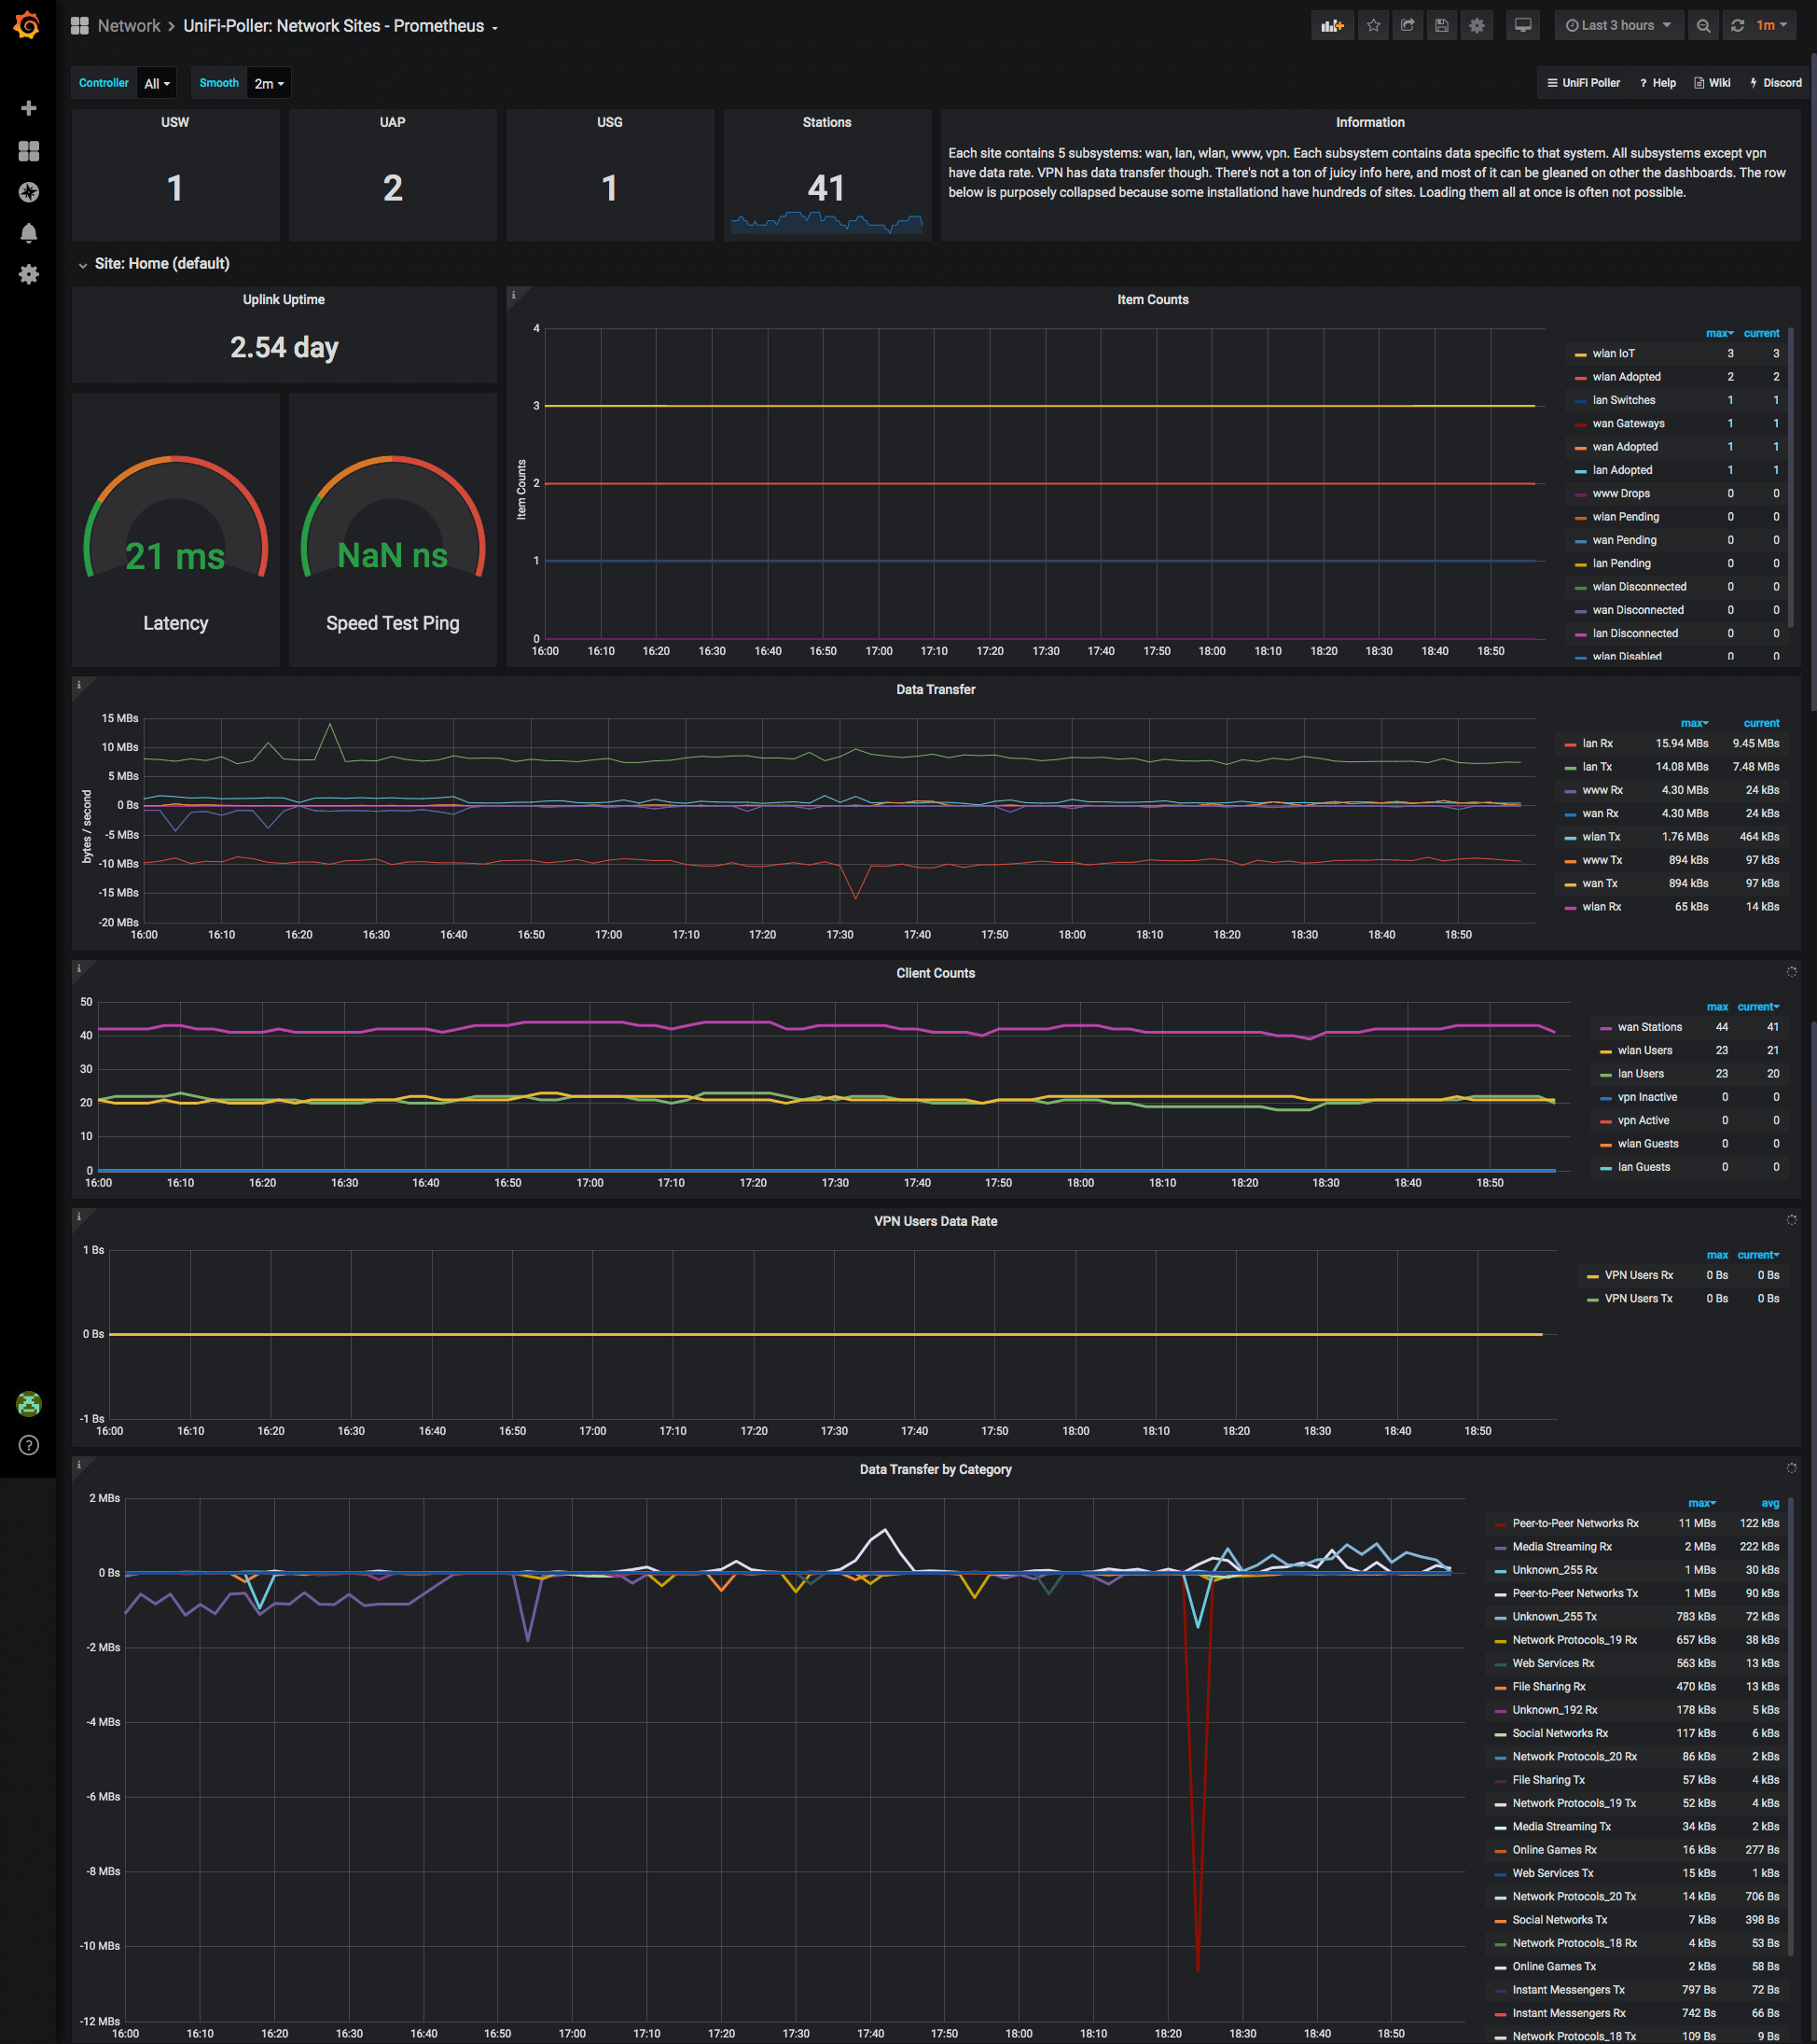
This dashboard monitors UniFi network health across multiple sites by aggregating device-level metrics from Prometheus, with panels like USW, UAP, USG, and Stations that visualize per-site counts and statuses. It highlights key metrics such as unpoller_site_switches, unpoller_site_aps, and unpoller_site_gateways to track port/high availability, wireless AP deployment, and gateway uptime, while per-site trends help identify saturation or outages at a glance**.
Screenshots
Used Metrics 44
unpoller_site_aps
unpoller_site_gateways
unpoller_site_stations
unpoller_site_switches
Get Dashboard✕
Download
Copy to Clipboard