UniFi-Poller: Client Insights - Prometheus 664,598664,598 5.0 (1 reviews)
Description
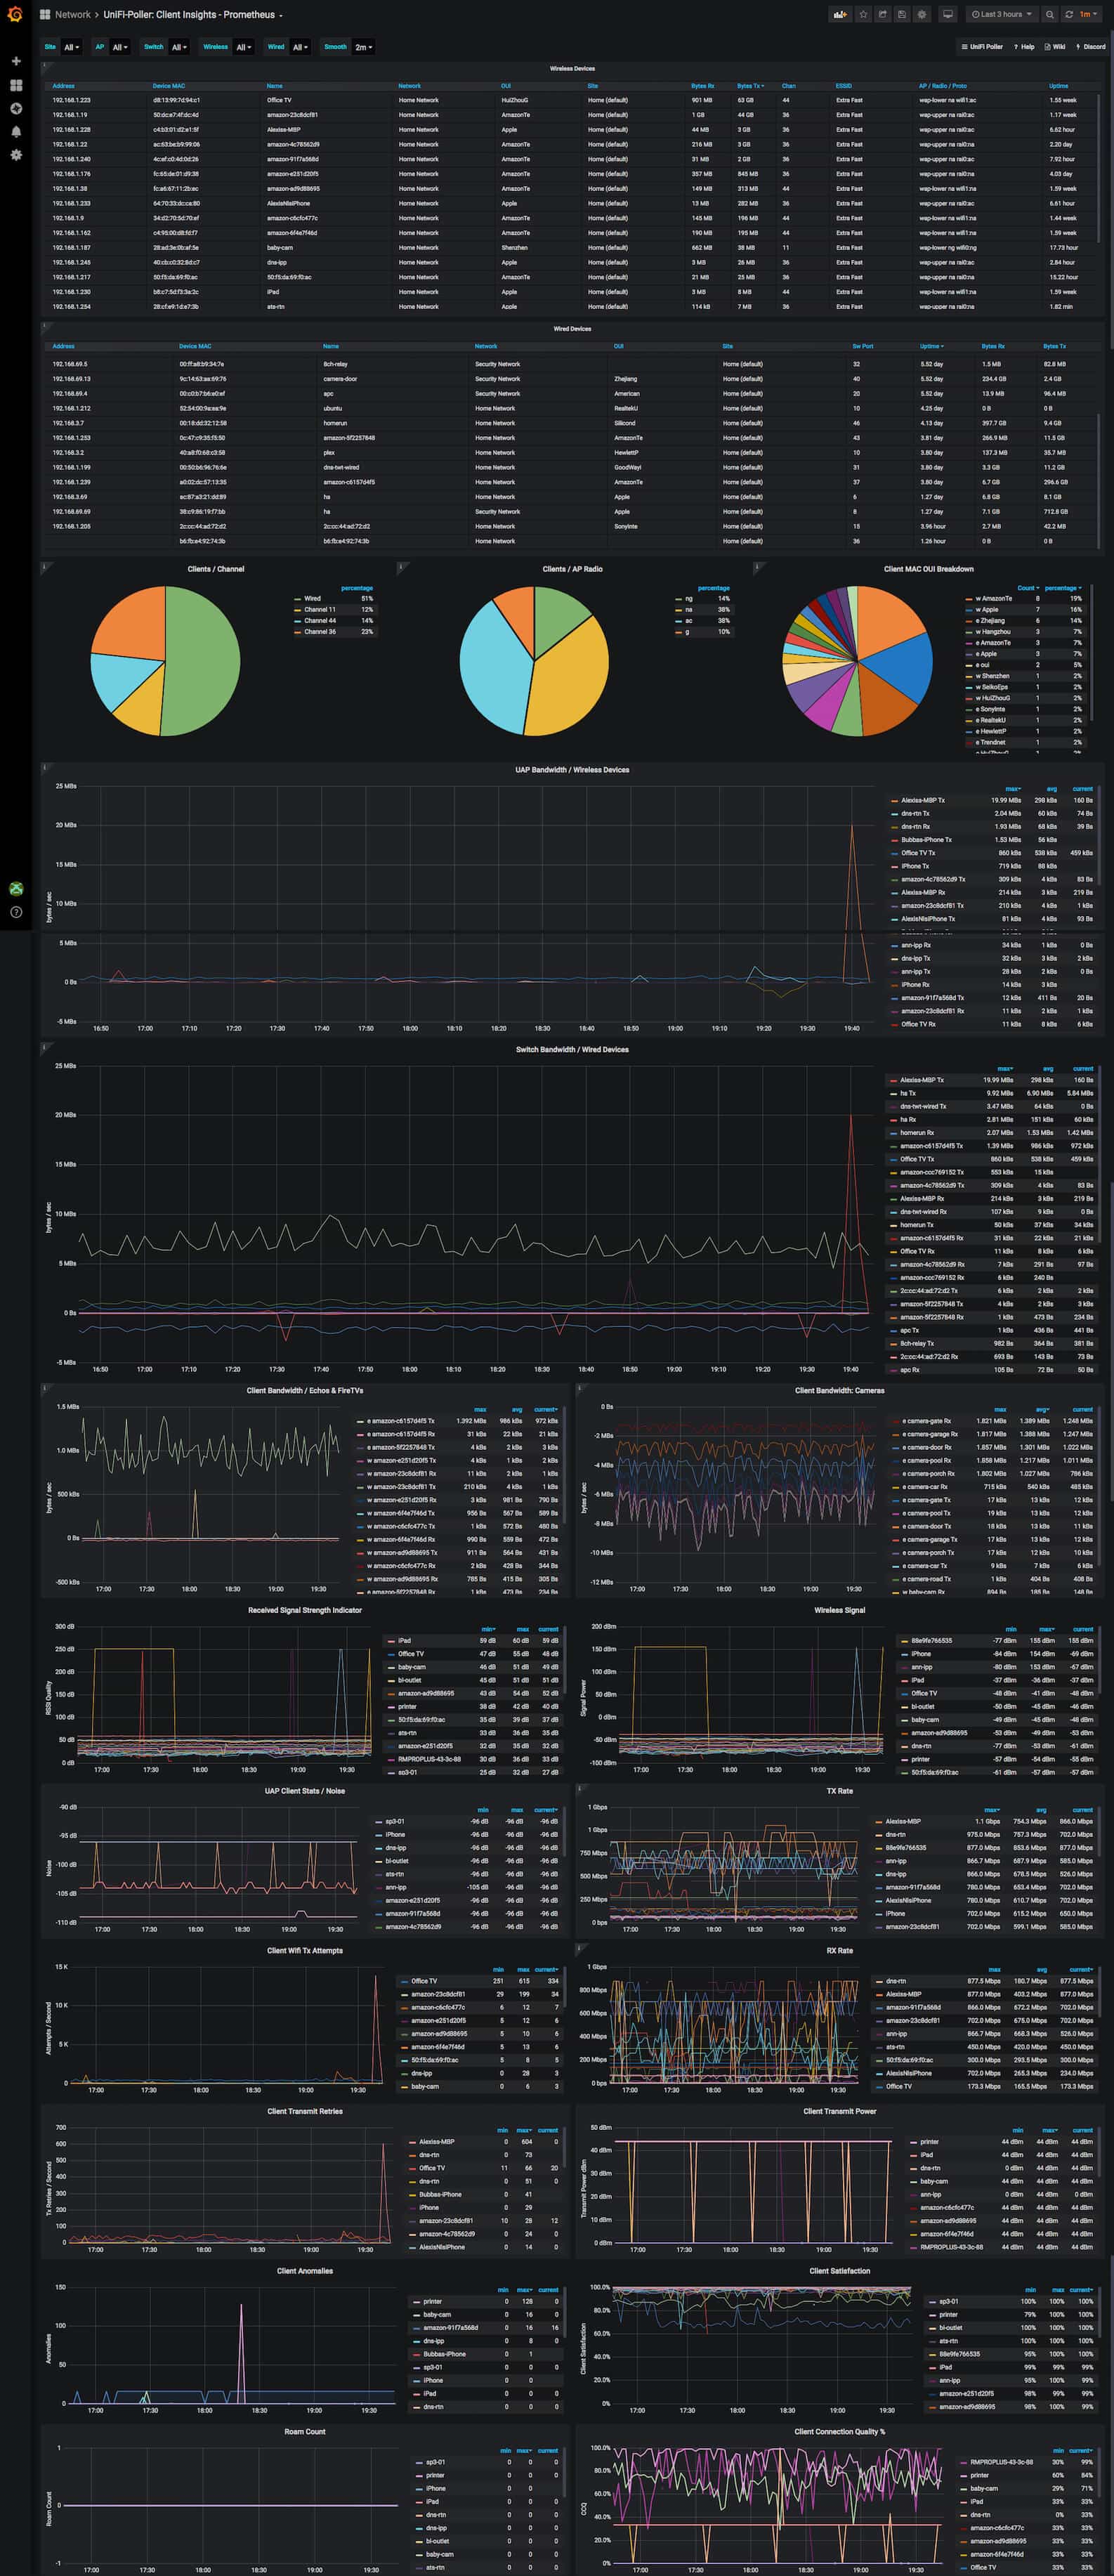
This dashboard provides a comprehensive view of client activity and performance across UniFi networks, aggregating both wireless and wired device insights. It highlights key metrics such as unpoller_client_receive_bytes_total, unpoller_client_transmit_bytes_total, and unpoller_client_rssi_db to track throughput, uplink/downlink activity, and signal quality, while also offering granular panels for per‑AP/ per‑device metrics like Roam Count and TX/RX rates for proactive troubleshooting and capacity planning.
Screenshots
Used Metrics 1515
unpoller_client_anomalies
unpoller_client_ccq_ratio
unpoller_client_noise_db
unpoller_client_radio_receive_rate_bps
unpoller_client_radio_signal_db
unpoller_client_radio_transmit_power_dbm
unpoller_client_radio_transmit_rate_bps
unpoller_client_receive_bytes_total
unpoller_client_roam_count_total
unpoller_client_rssi_db
unpoller_client_satisfaction_ratio
unpoller_client_transmit_bytes_total
unpoller_client_transmit_retries_total
unpoller_client_uptime_seconds
unpoller_client_wifi_attempts_transmit_total