UniFi-Poller: Client DPI - Prometheus 22,41722,417
11/29/2019
1/1/2023
5
Host Metrics
>=7.0.3
Prometheus
Description
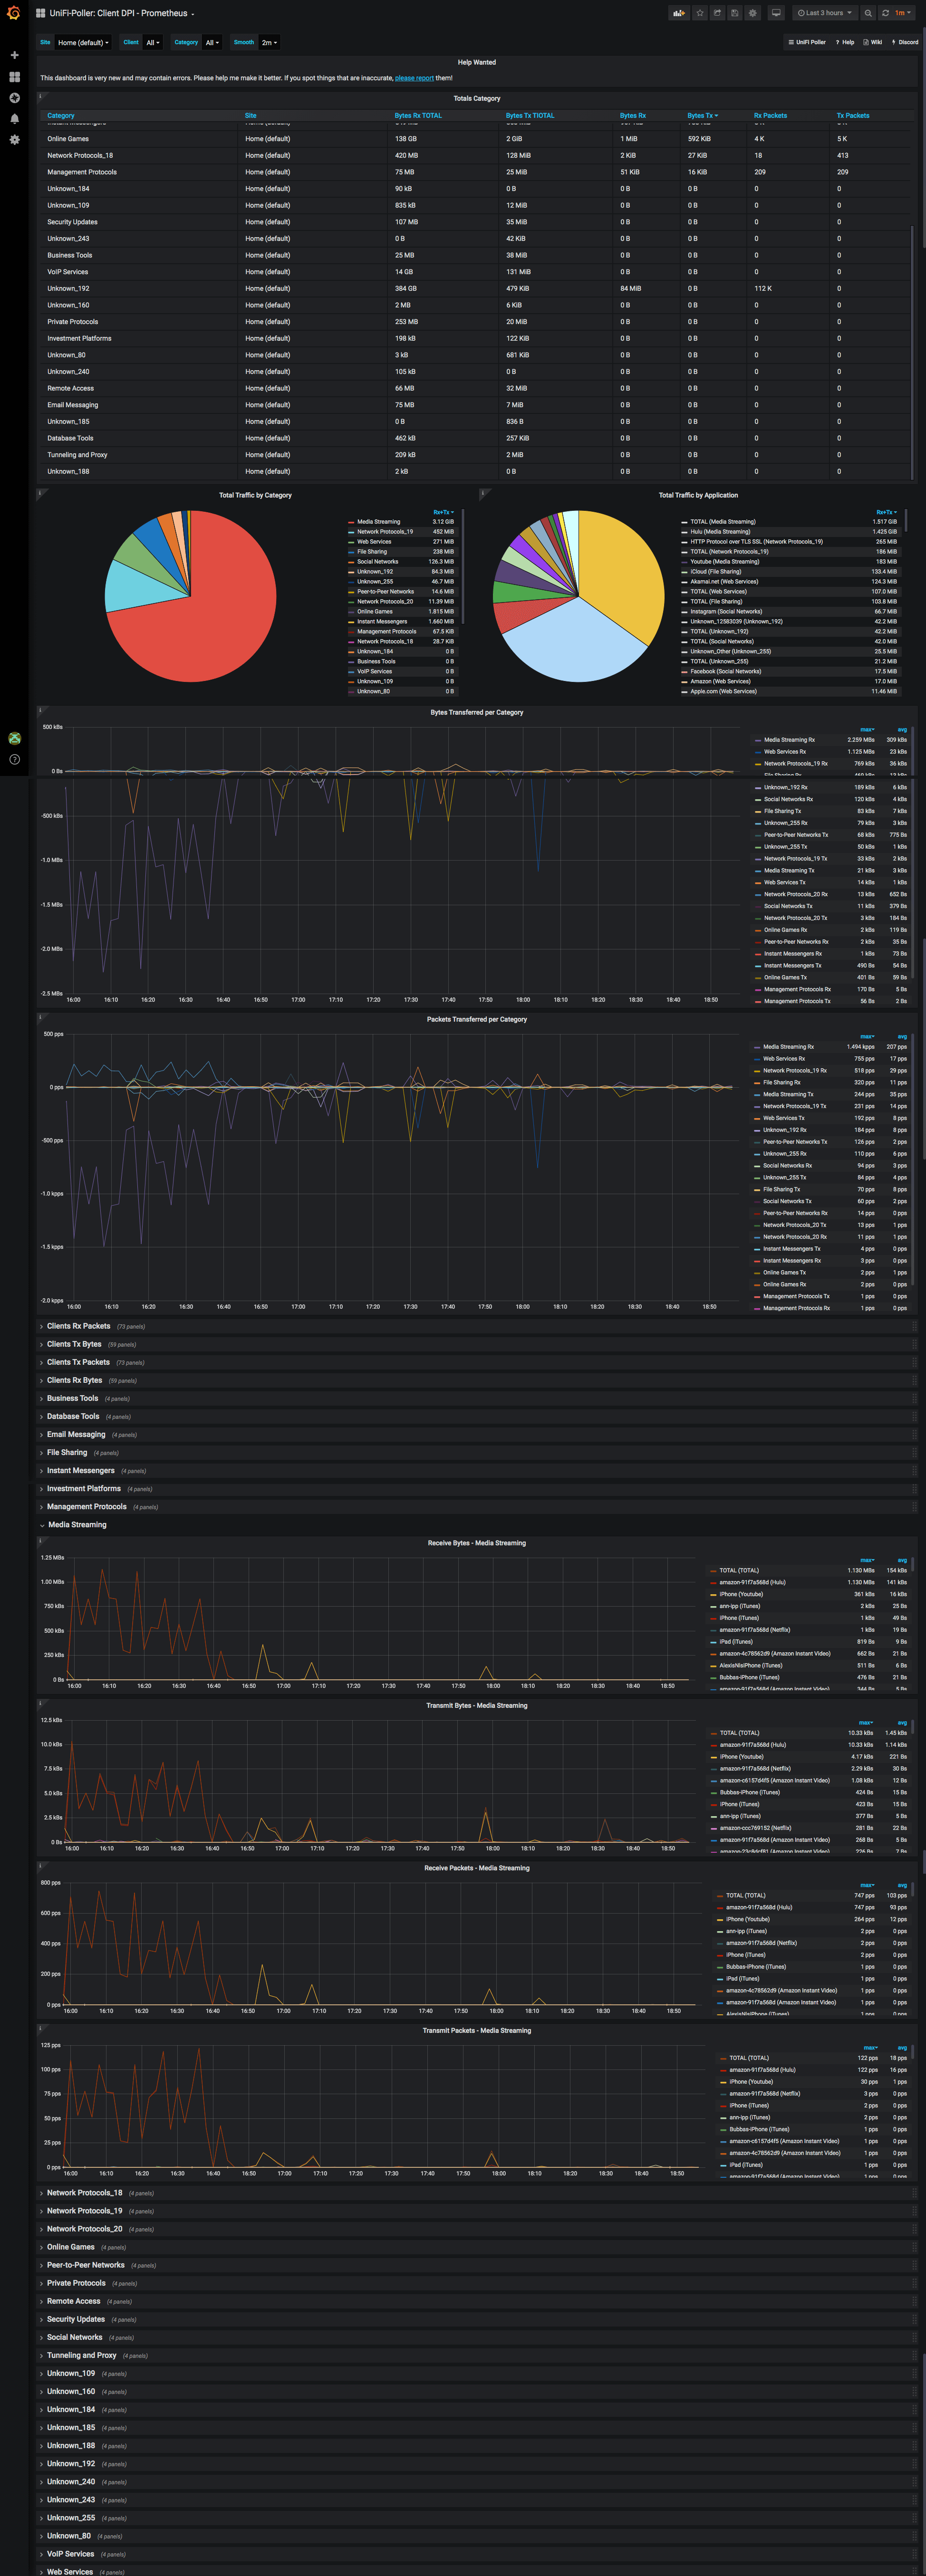
UniFi Poller v2.0.1 Displays DPI information for clients in a UniFi network using Prometheus.
Screenshots
Used Metrics 44
unpoller_client_dpi_receive_bytes
unpoller_client_dpi_receive_packets
unpoller_client_dpi_transmit_bytes
unpoller_client_dpi_transmit_packets
Get Dashboard✕
Download
Copy to Clipboard