Unbound 76,02976,029
Description
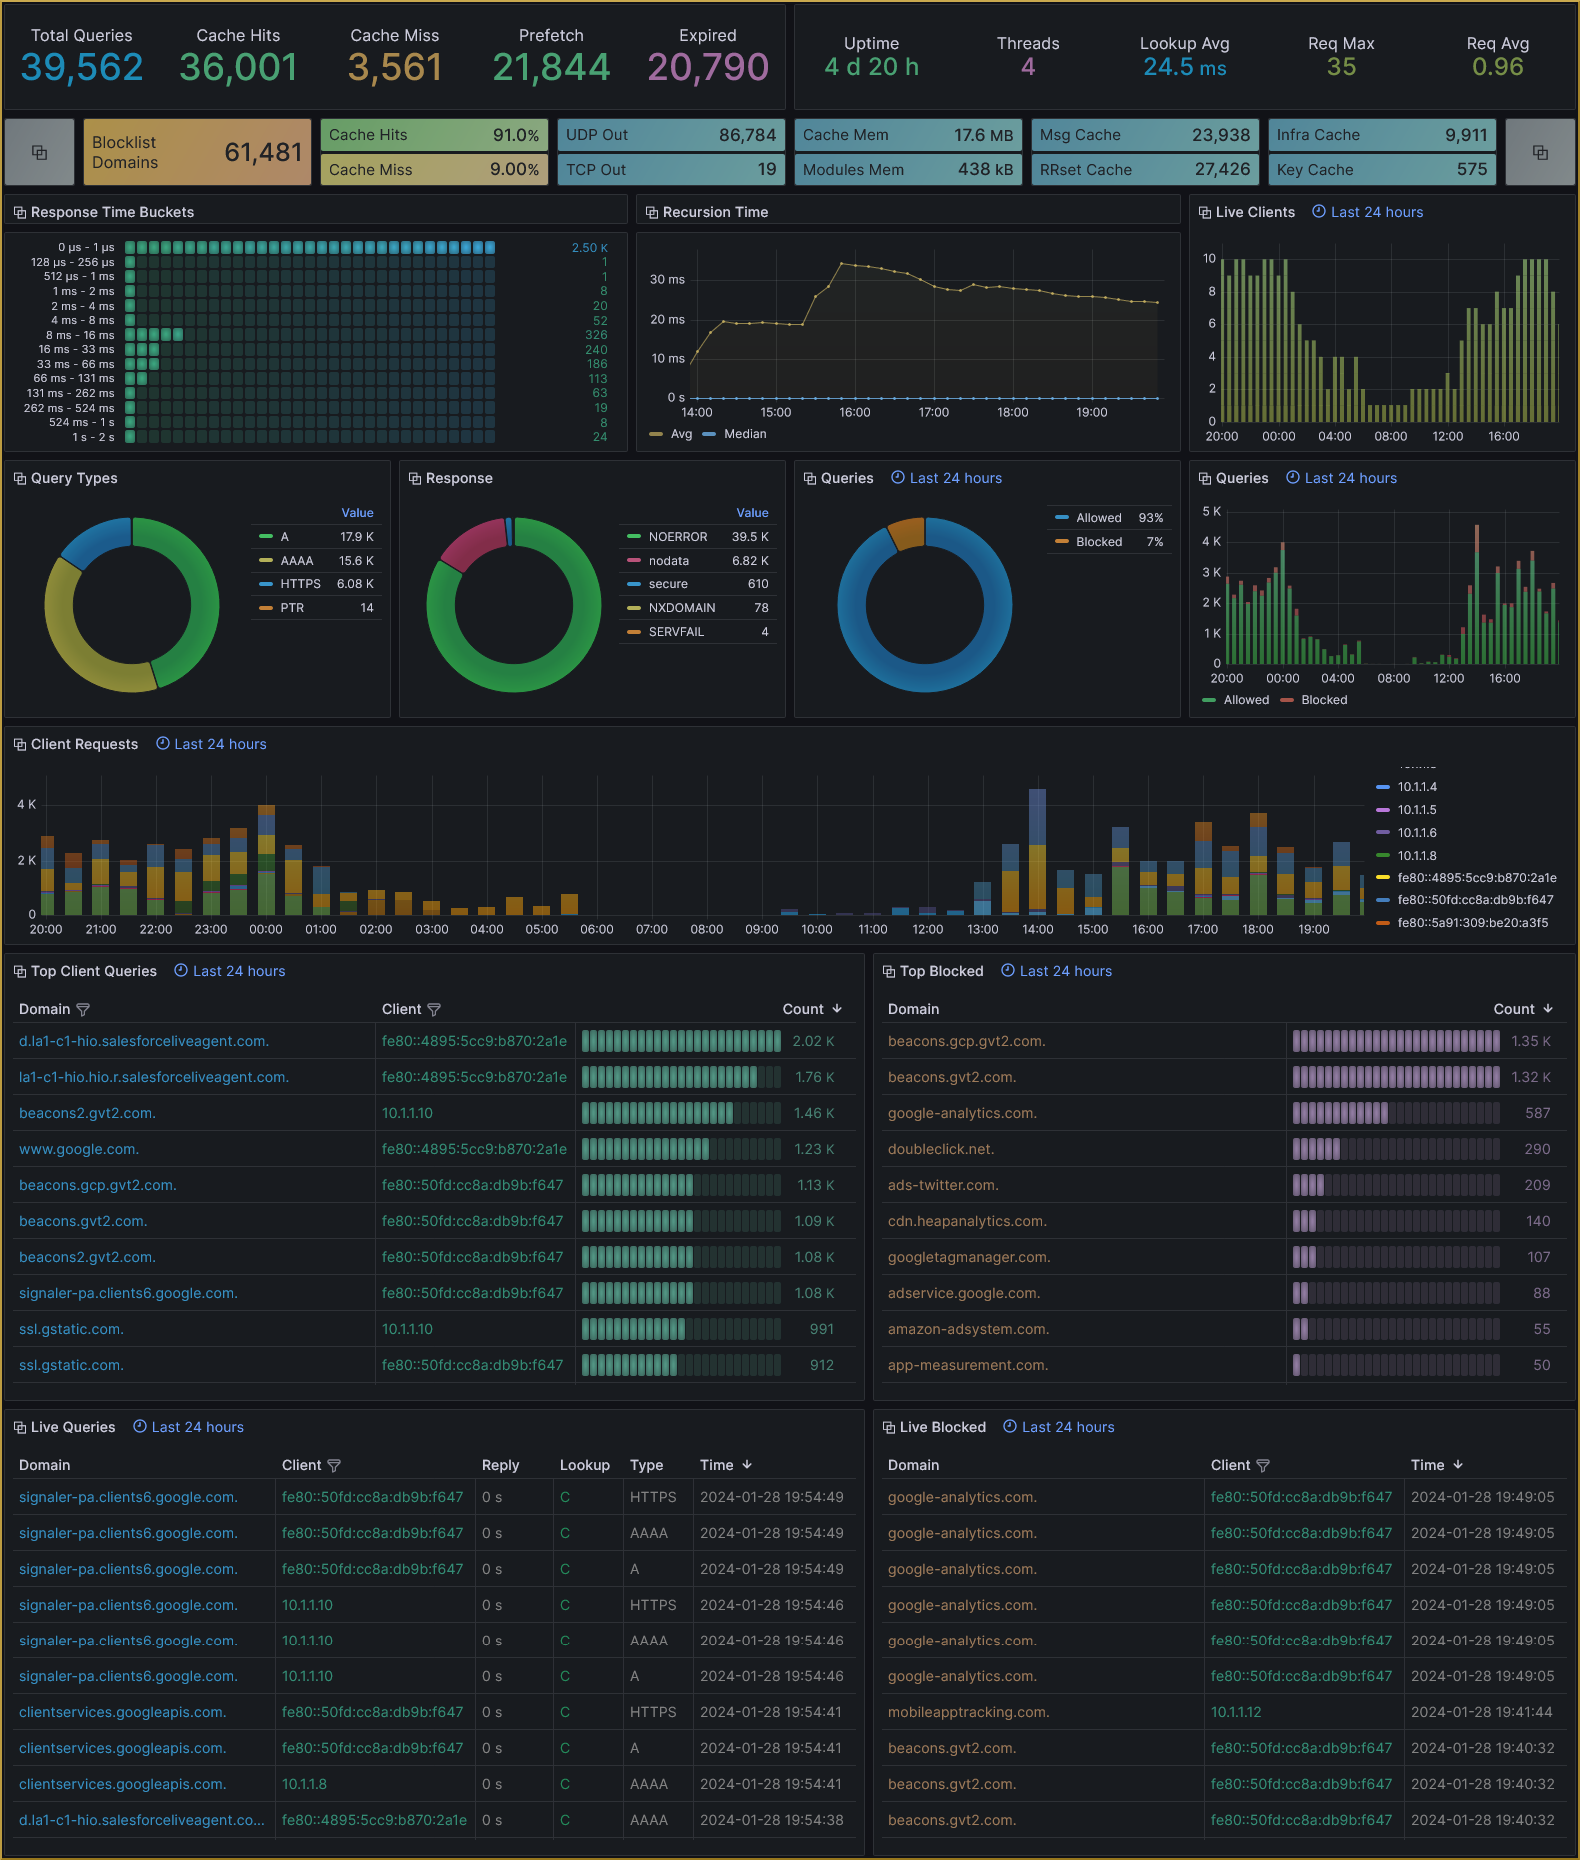
This dashboard monitors the health and performance of an Unbound DNS resolver, aggregating query throughput, cache behavior, and response characteristics. It highlights live client activity, query type distribution, and response outcomes with key metrics such as unbound_queries_total, unbound_cache_hit_total, and unbound_cache_miss_total to reveal cache effectiveness and query load, while additional panels track request handling time and average/maximum request list sizes for latency and scalability insights.
Screenshots
Used Metrics 3434
_
cache
client
domain
lookup_time
pattern
-
scrape_duration_seconds
type
unbound_answer_bogus_count
unbound_answer_rcodes_count
unbound_answer_secure_count
unbound_blocklist_domain_count
unbound_cache_hit_total
unbound_cache_miss_total
unbound_expired_total
unbound_infra_cache_count
unbound_key_cache_count
unbound_memory_caches_bytes
unbound_memory_modules_bytes
unbound_msg_cache_count
unbound_prefetch_total
unbound_queries_total
unbound_query_tcpout_count
unbound_query_types_count
unbound_query_udpout_count
unbound_recursion_time_avg_seconds
unbound_recursion_time_median_seconds
unbound_request_list_avg
unbound_request_list_current_user
unbound_request_list_max
unbound_response_time_buckets
unbound_rrset_cache_count
unbound_time_up_seconds
-
up