TrueNAS 1,7591,759
9/26/2023
9/26/2023
1
>=10.1.2
Prometheus
Description
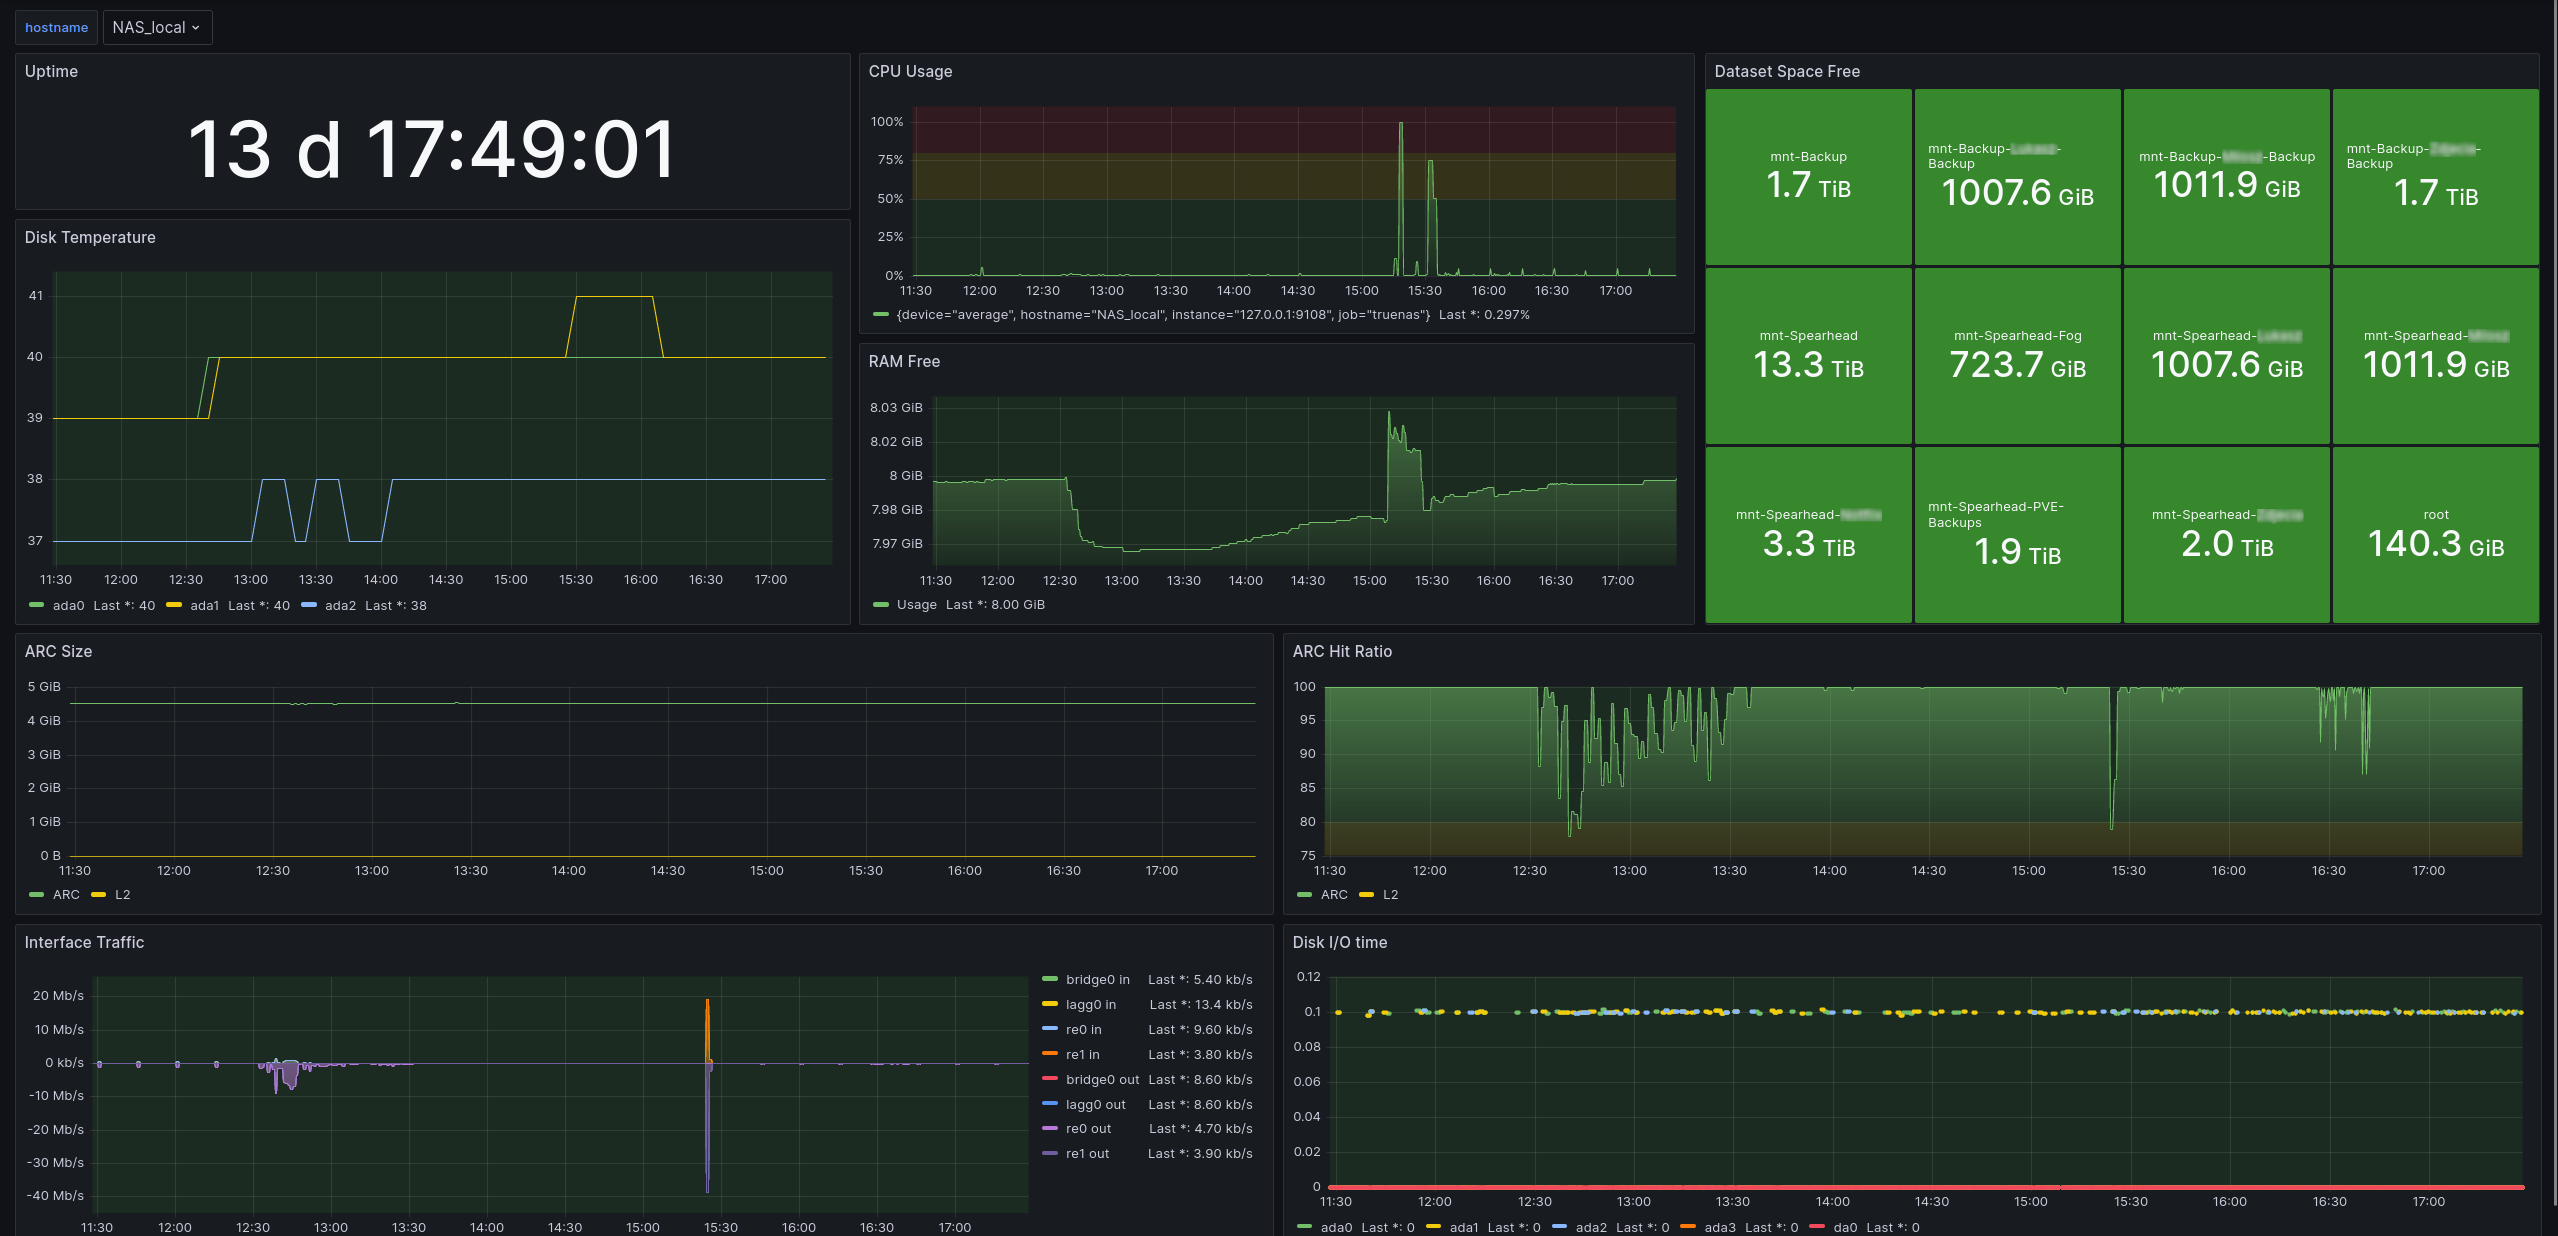
A simple and clean TrueNAS Core/Scale grafana dashboard based on prometheus
Screenshots
Used Metrics 1414
truenas_aggregation_cpu_gauge_nice
truenas_aggregation_cpu_gauge_system
truenas_aggregation_cpu_gauge_user
truenas_dataset_df_complex_free
truenas_disk_io_time_io_time
truenas_disktemp_temperature
truenas_interface_packets_rx
truenas_interface_packets_tx
truenas_memory_free
truenas_uptime_uptime
truenas_zfs_arc_cache_ratio_L2
truenas_zfs_arc_cache_ratio_arc
truenas_zfs_arc_cache_size_L2
truenas_zfs_arc_cache_size_arc
Get Dashboard✕
Download
Copy to Clipboard