Troubleshooting Kubernetes (simple and fast view) 9,1519,151 5.0 (1 reviews)
11/4/2021
4/11/2022
3
>=8.0.3
PrometheusLoki
Description
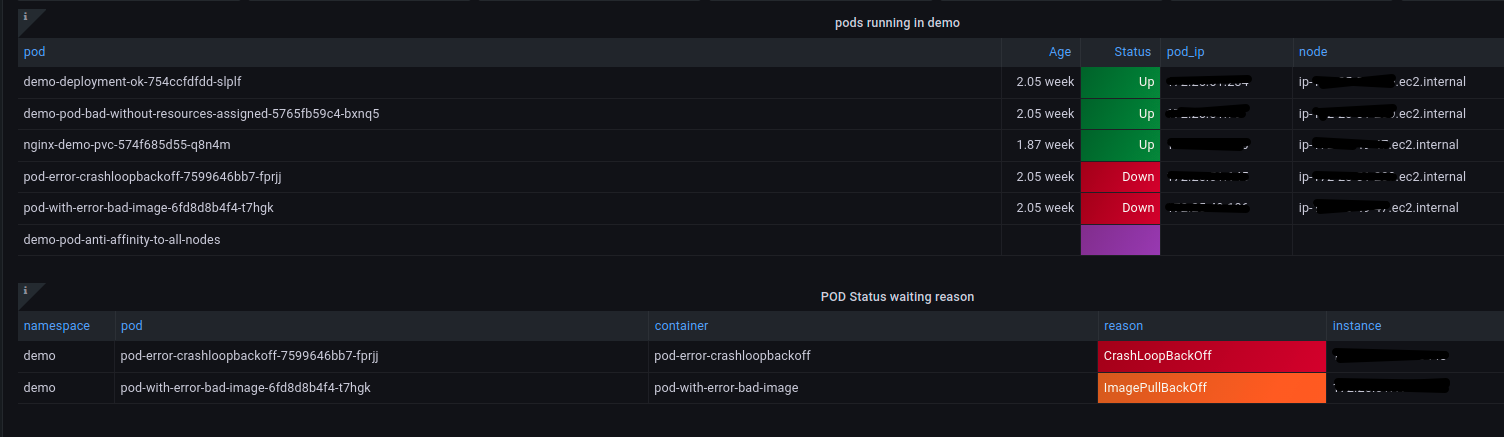
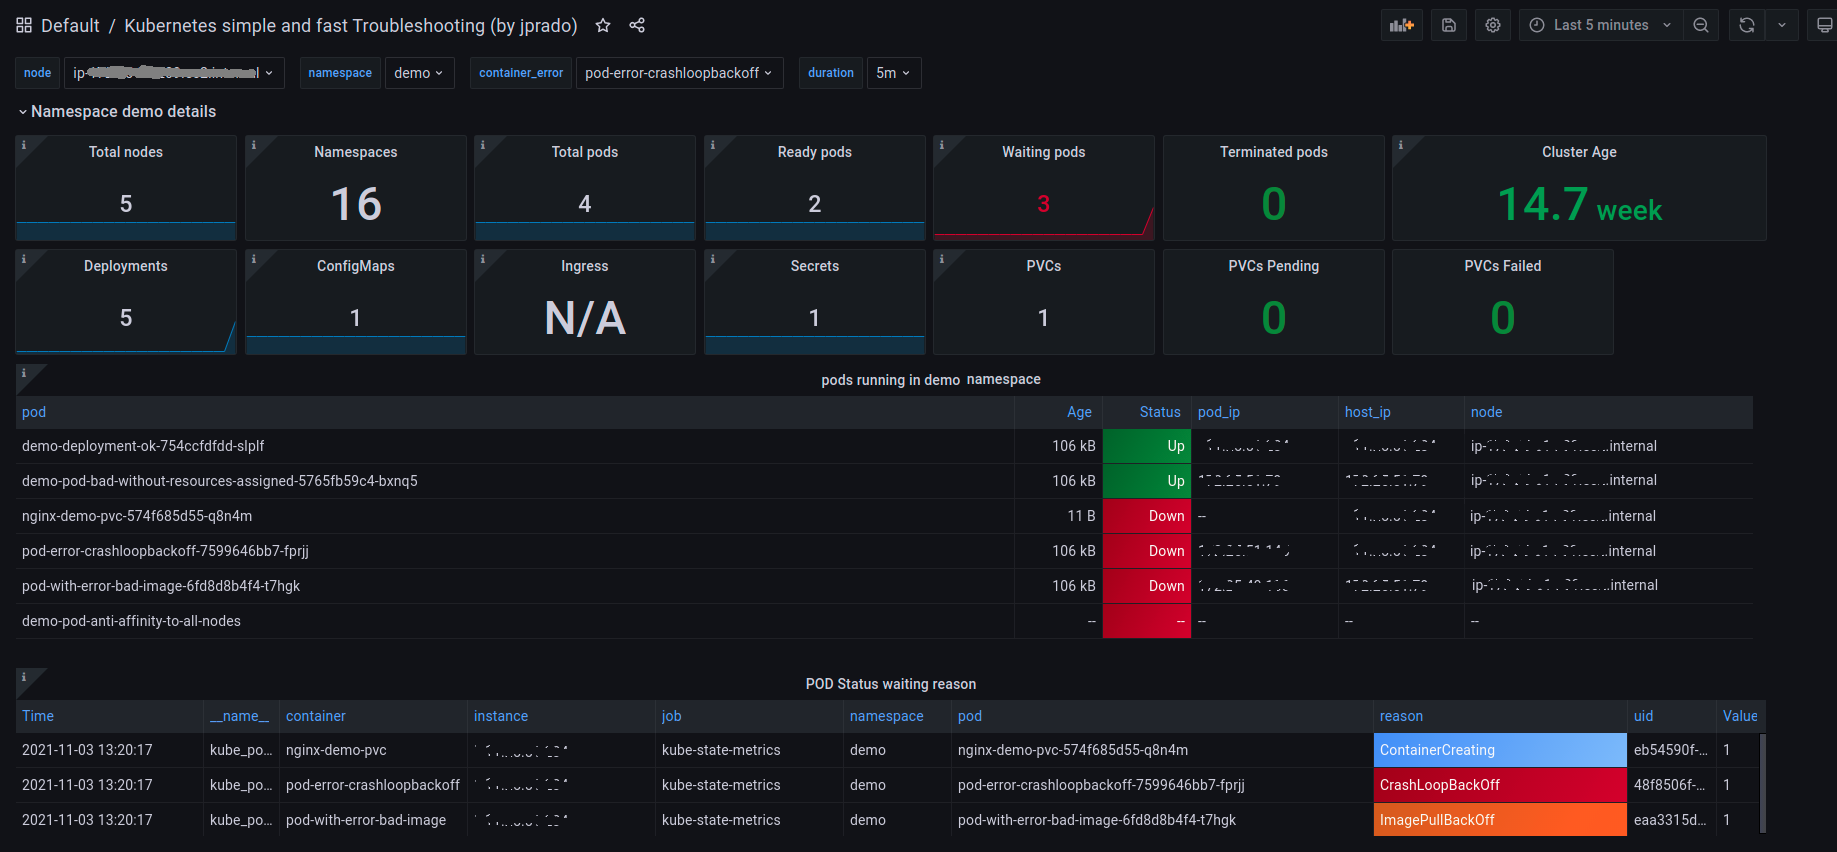
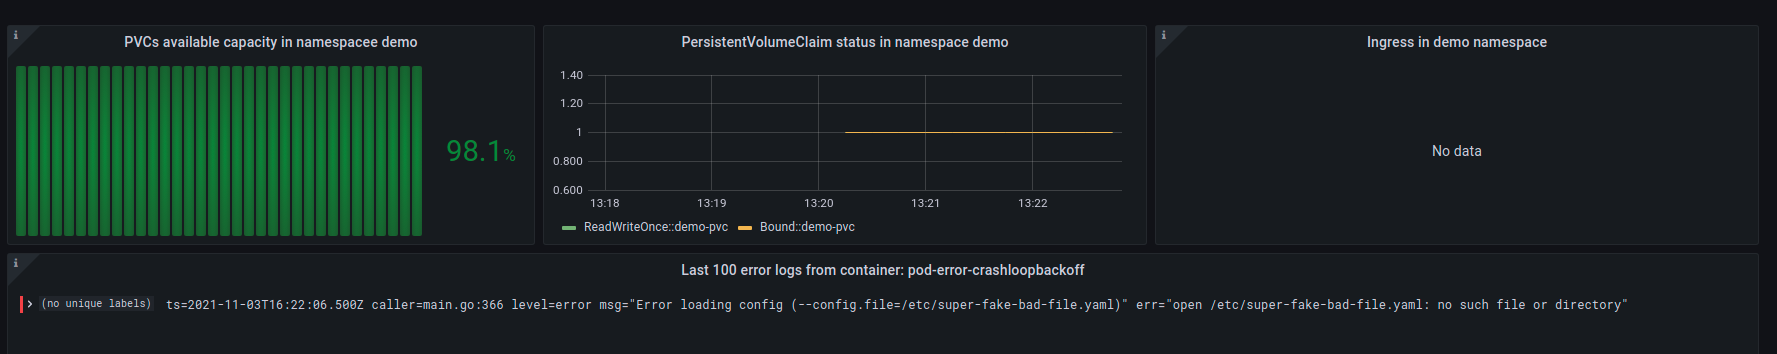
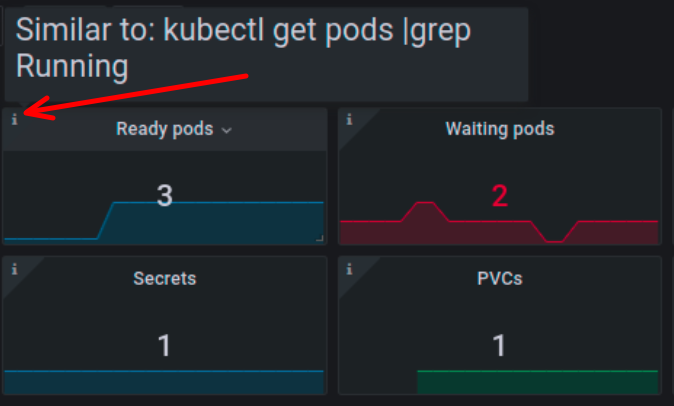
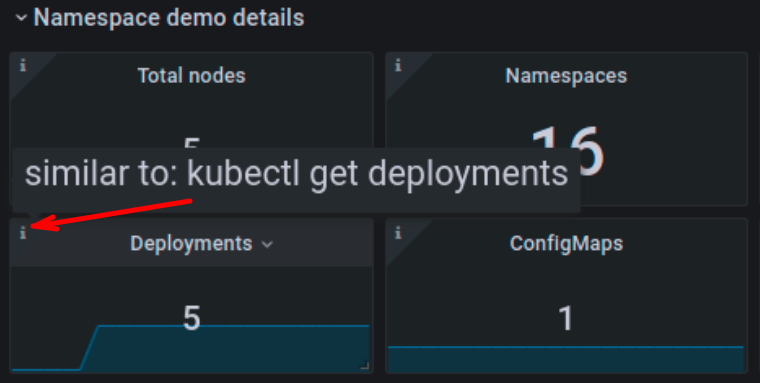
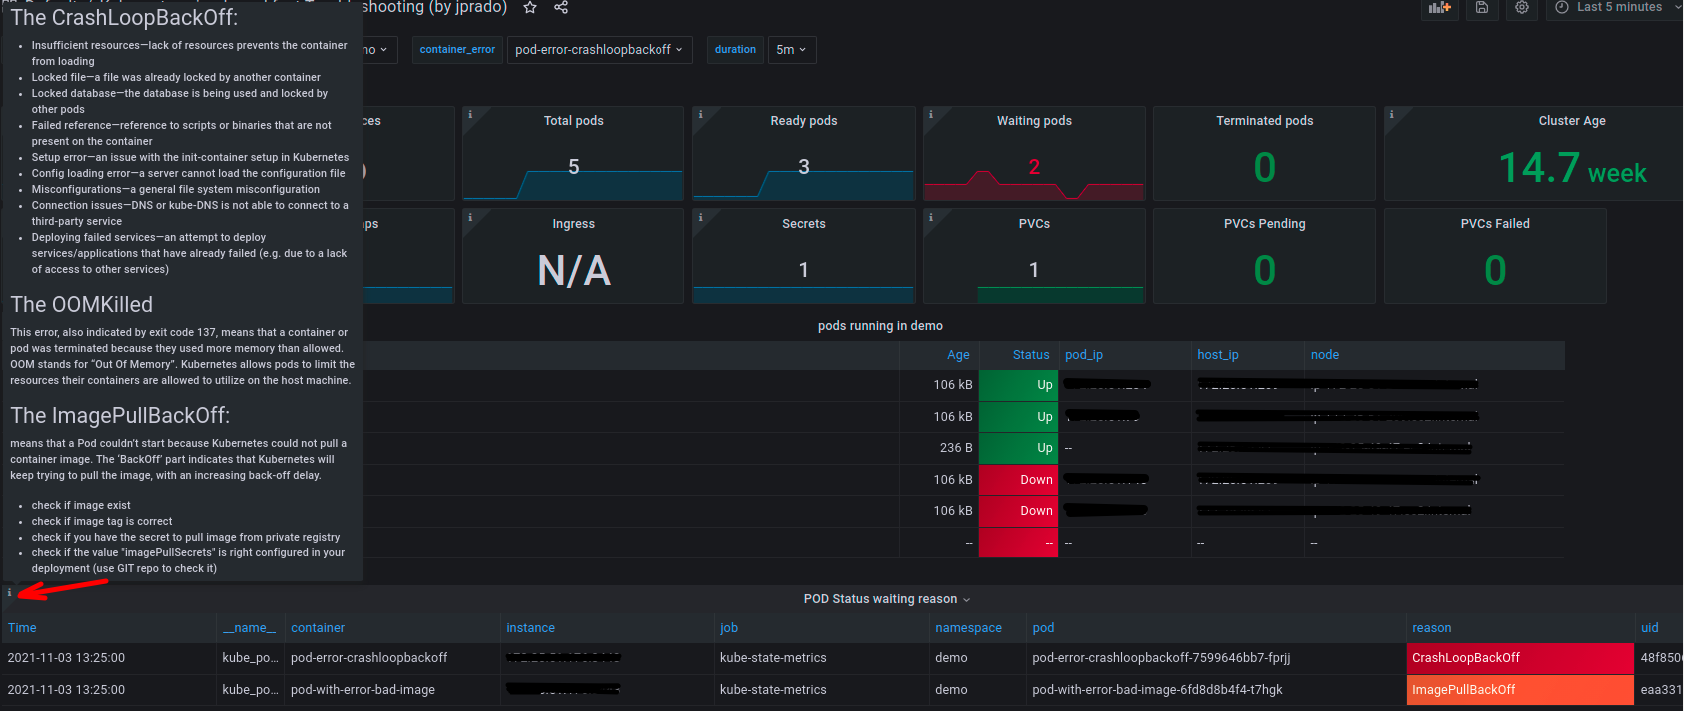
Simple and fast Troubleshooting Dashboard for kubernetes
Screenshots
Used Metrics 2222
container_spec_memory_reservation_limit_bytes
kube_configmap_created
kube_deployment_created
kube_ingress_created
kube_ingress_path
kube_namespace_created
kube_node_info
kube_persistentvolume_status_phase
kube_persistentvolumeclaim_access_mode
kube_persistentvolumeclaim_info
kube_persistentvolumeclaim_status_phase
kube_pod_container_status_ready
kube_pod_container_status_restarts_total
kube_pod_container_status_terminated
kube_pod_container_status_waiting
kube_pod_container_status_waiting_reason
kube_pod_info
kube_pod_start_time
kube_secret_created
kube_service_created
kubelet_volume_stats_available_bytes
kubelet_volume_stats_capacity_bytes
Get Dashboard✕
Download
Copy to Clipboard