Trivy Operator Dashboard 1,500,3211,500,321 5.0 (1 reviews)
1/6/2023
3/24/2023
2
Host Metrics
>=9.3.1
Prometheus
Description
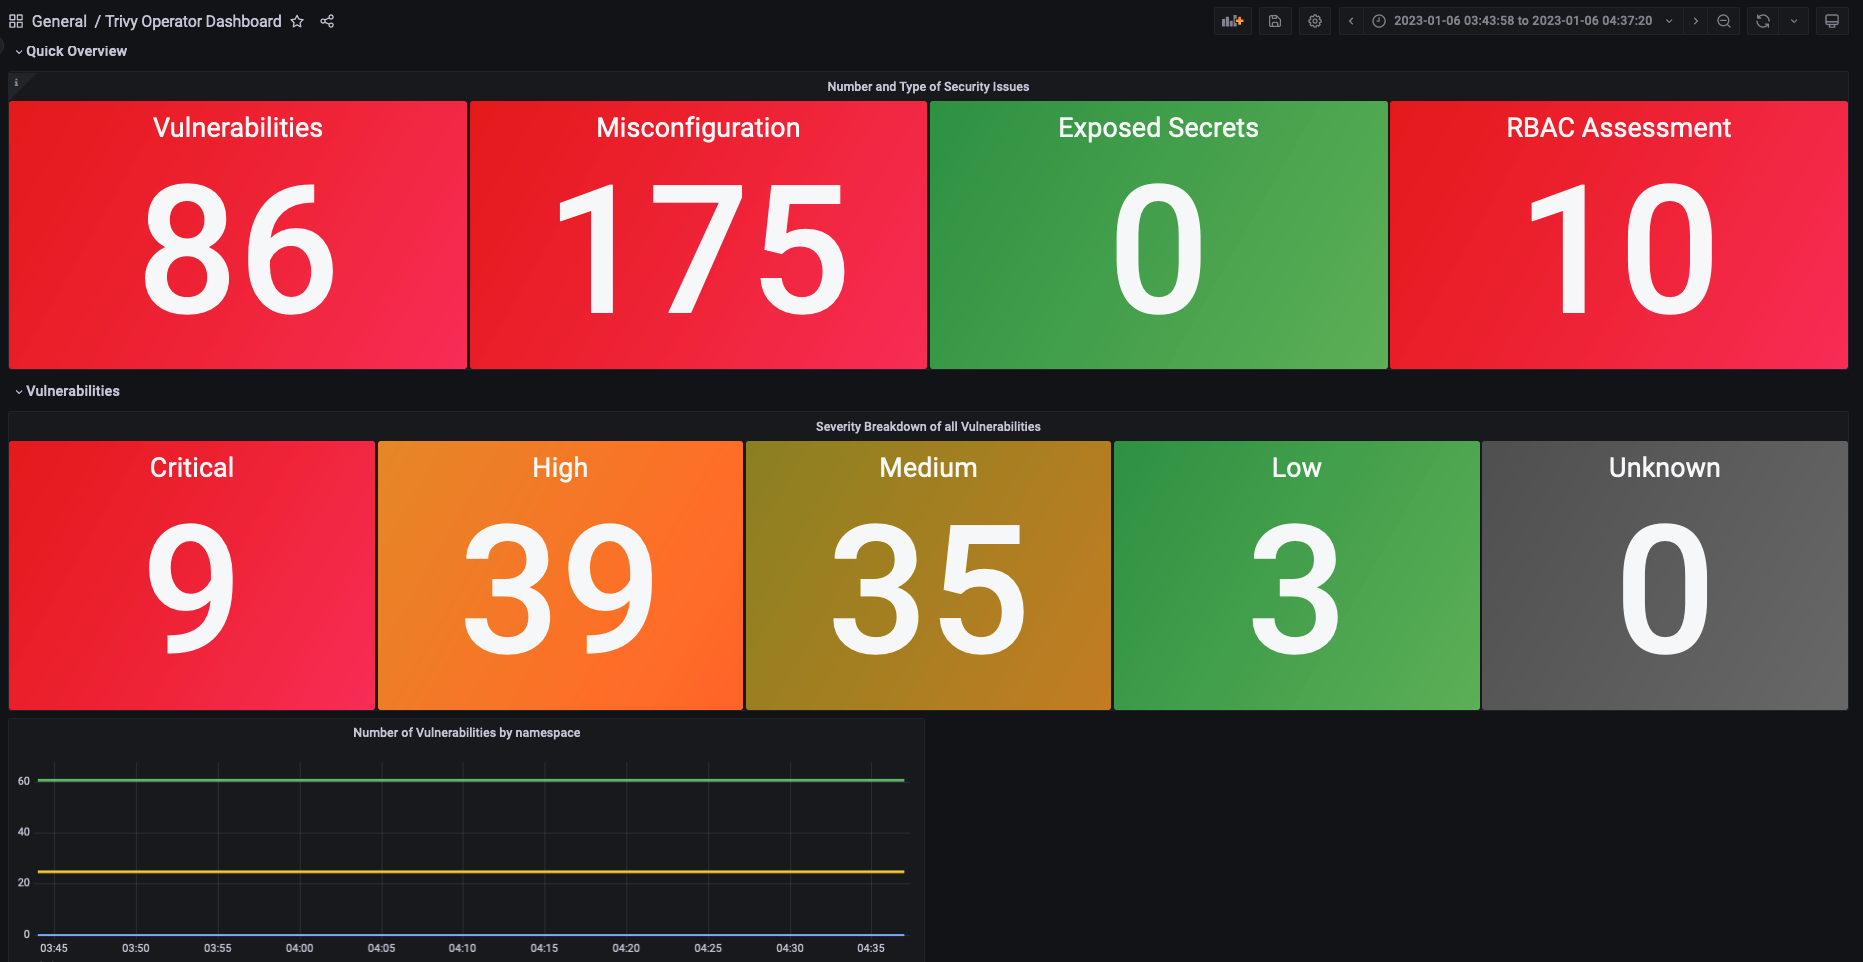
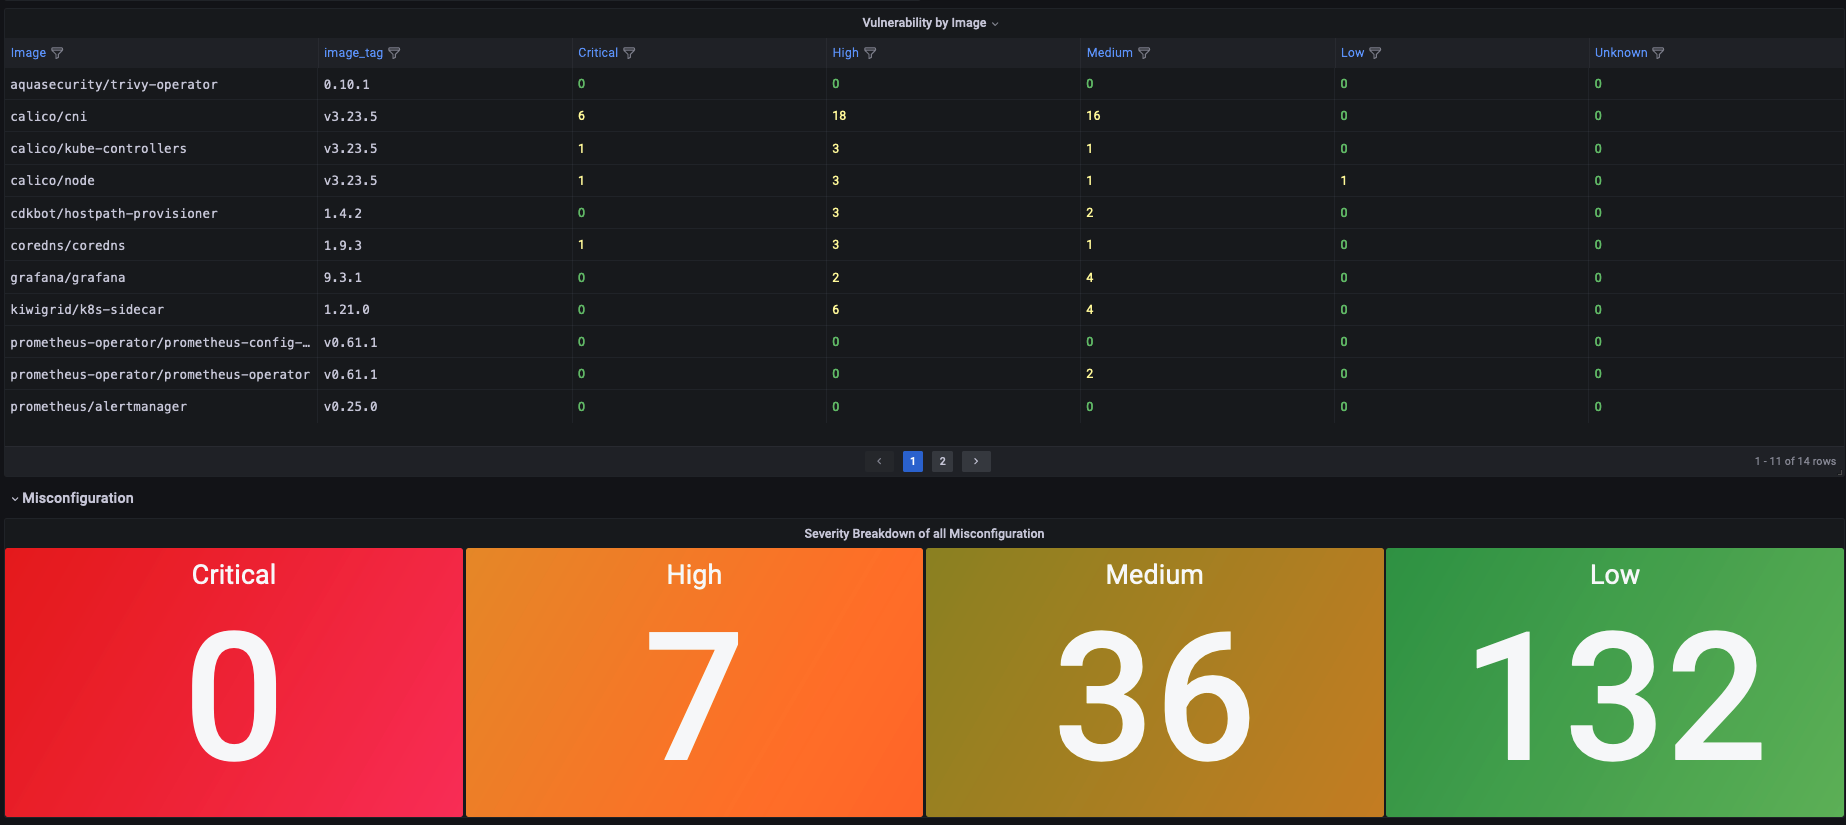
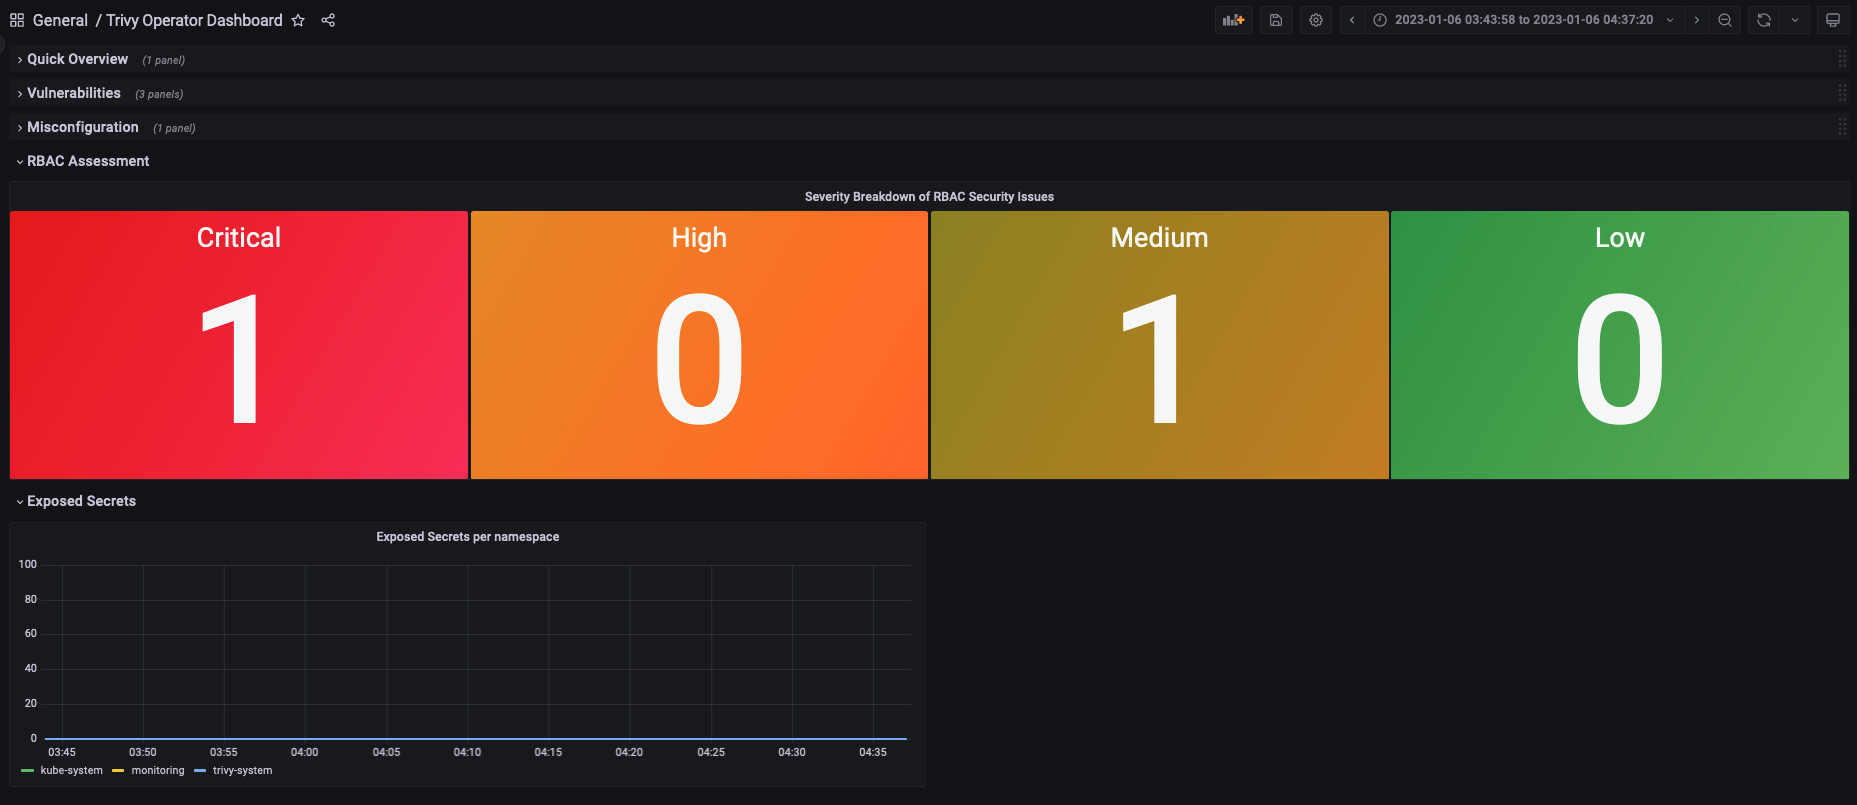
This dashboard monitors container image security via the Trivy Operator, focusing on vulnerability and policy exposure across clusters. Key panels highlight image scan results, vulnerability counts by severity, and scan duration or throughput metrics. Notable metrics include trivy_vulnerability_severity_count, trivy_scan_duration_seconds, and trivy_image_scan_status to track risk levels, performance, and scan success rates in real time.
Screenshots
Get Dashboard✕
Download
Copy to Clipboard