Traefik3 3,7913,791
8/9/2017
11/26/2019
3
DockerWeb Servers
>=6.5.0
Prometheus
Description
Traefik v2.0 dashboard Prometheus Stack
Screenshots
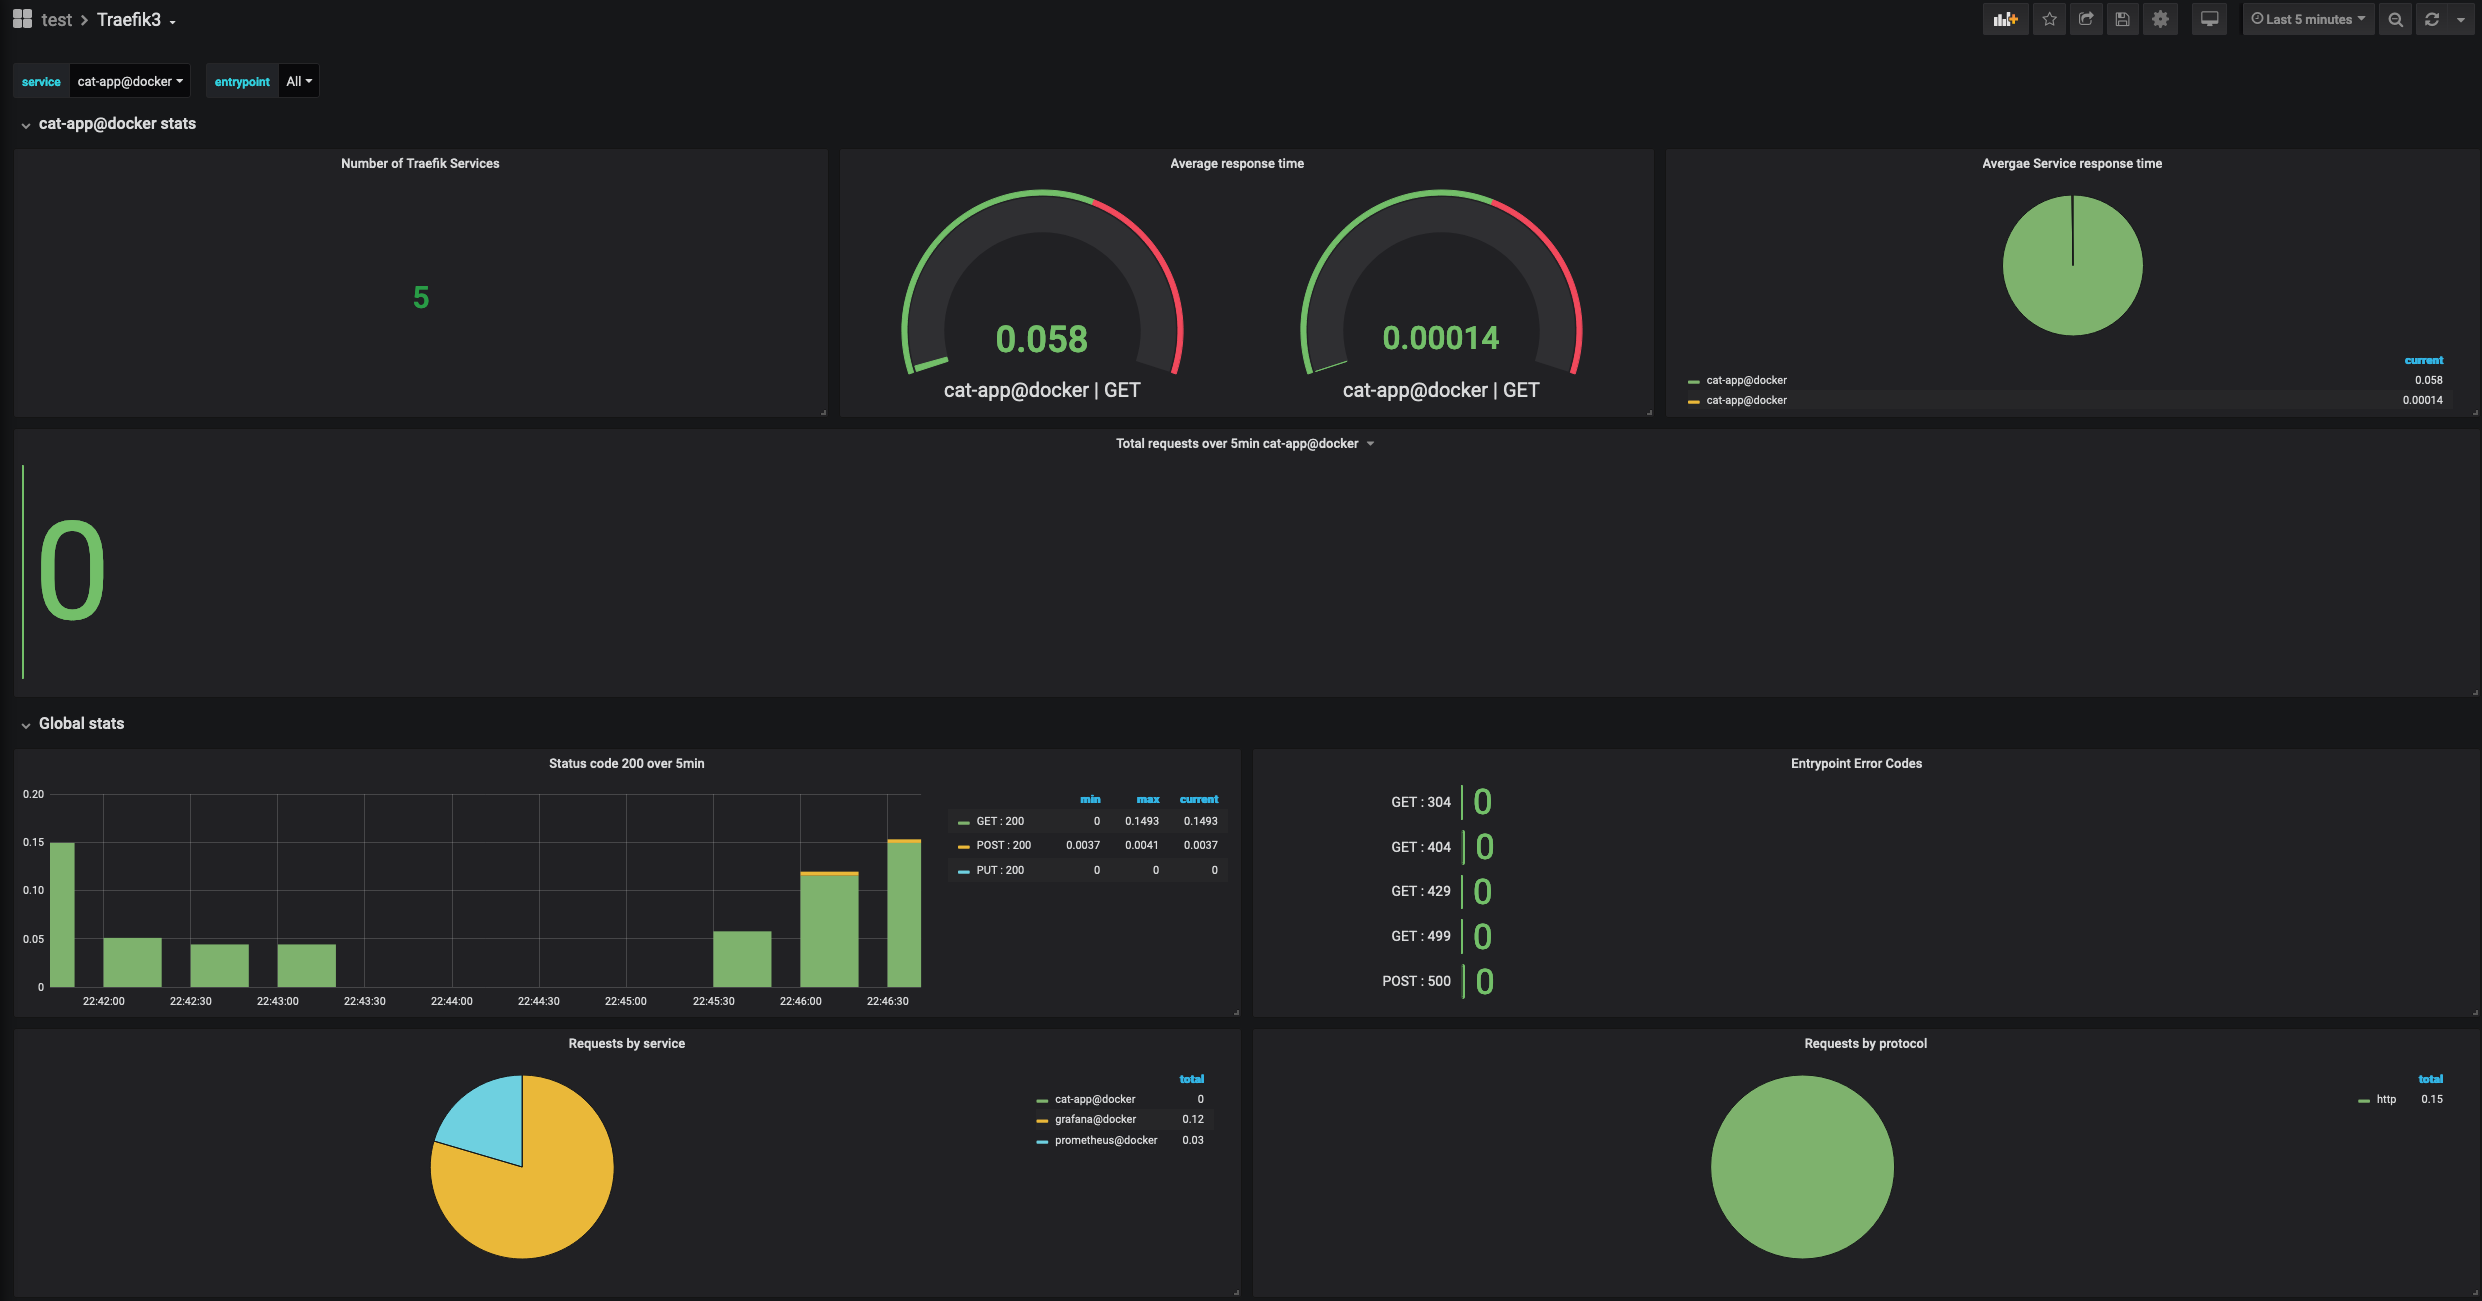
Used Metrics 44
traefik_entrypoint_requests_total
traefik_service_open_connections
traefik_service_request_duration_seconds_sum
traefik_service_requests_total
Get Dashboard✕
Download
Copy to Clipboard