Traefik2 446,914446,914 5.0 (1 reviews)
9/24/2019
9/24/2019
1
Host Metrics
>=6.3.6
Prometheus
Description
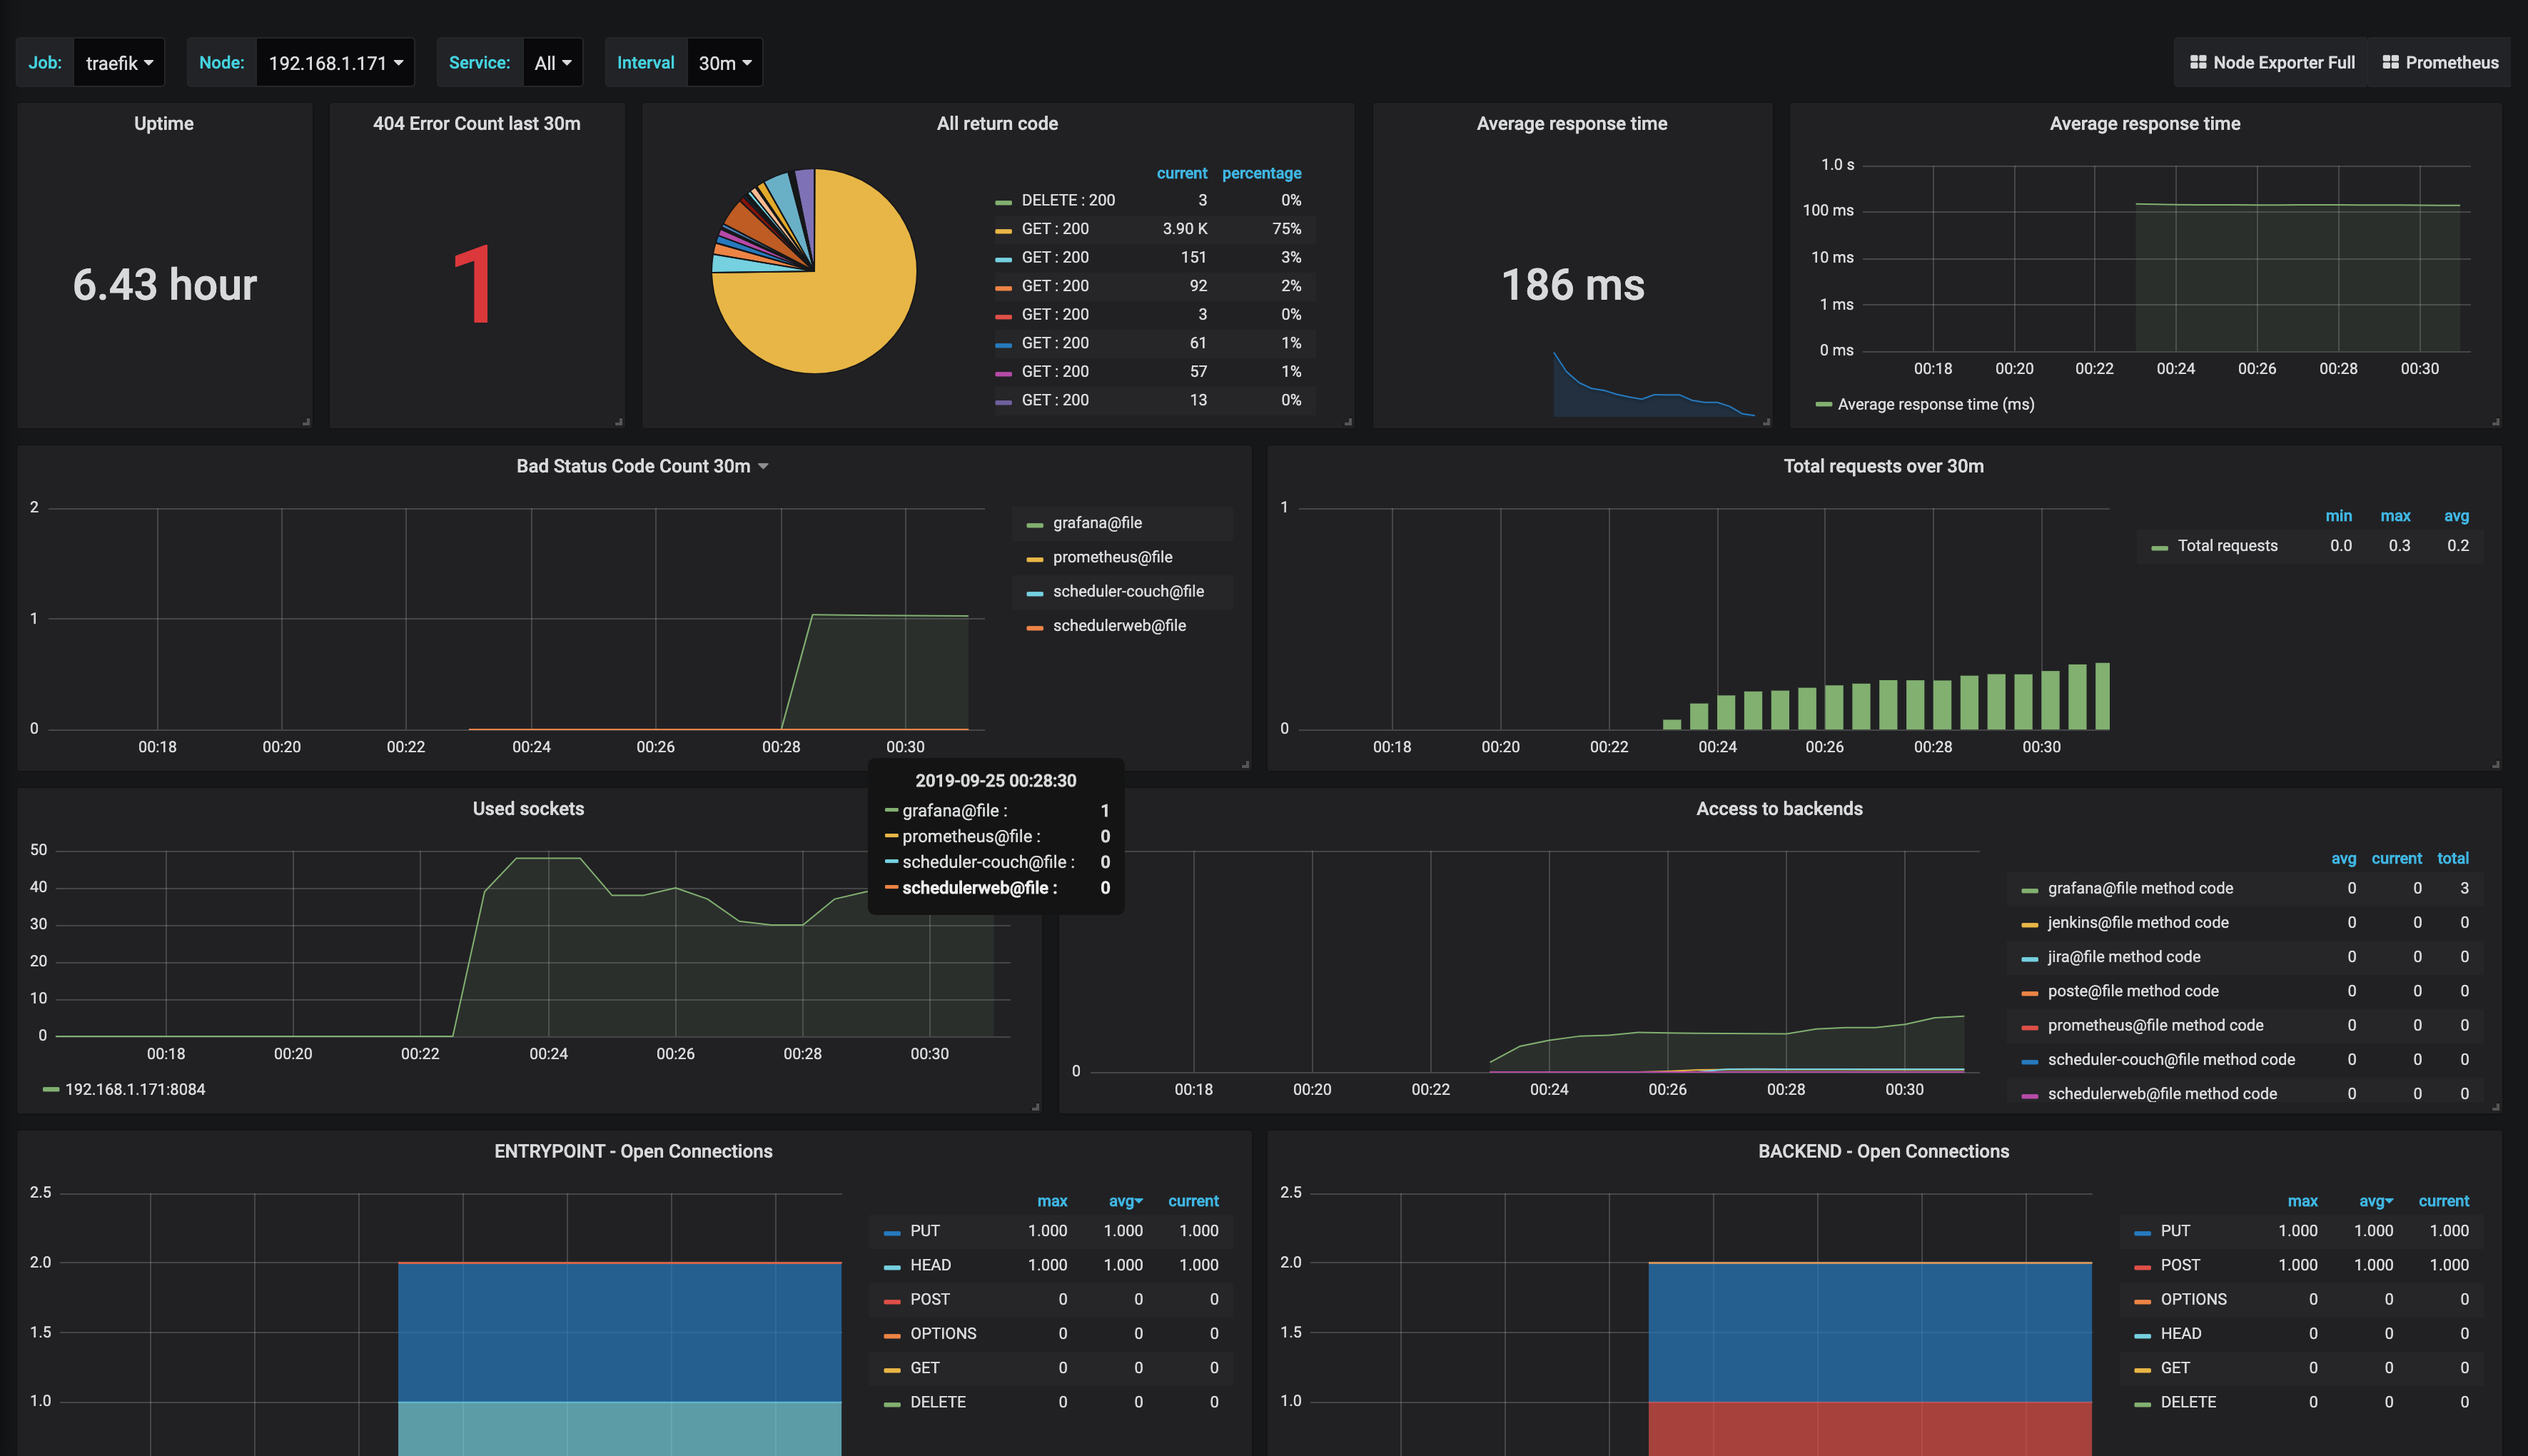
This dashboard monitors the health and performance of Traefik by aggregating runtime, traffic, and connection metrics. It highlights key signals such as process_start_time_seconds for uptime, traefik_service_requests_total and traefik_service_request_duration_seconds_sum for request rate and latency, and traefik_entrypoint_open_connections for active connection load, alongside error and status code trends across intervals to surface bottlenecks and outages.
Screenshots
Used Metrics 99
interval
-
process_open_fds
-
process_start_time_seconds
traefik_entrypoint_open_connections
traefik_entrypoint_request_duration_seconds_sum
traefik_entrypoint_requests_total
traefik_service_open_connections
traefik_service_request_duration_seconds_sum
traefik_service_requests_total
Get Dashboard✕
Download
Copy to Clipboard