Traefik Official Standalone Dashboard 1,682,7471,682,747
Description
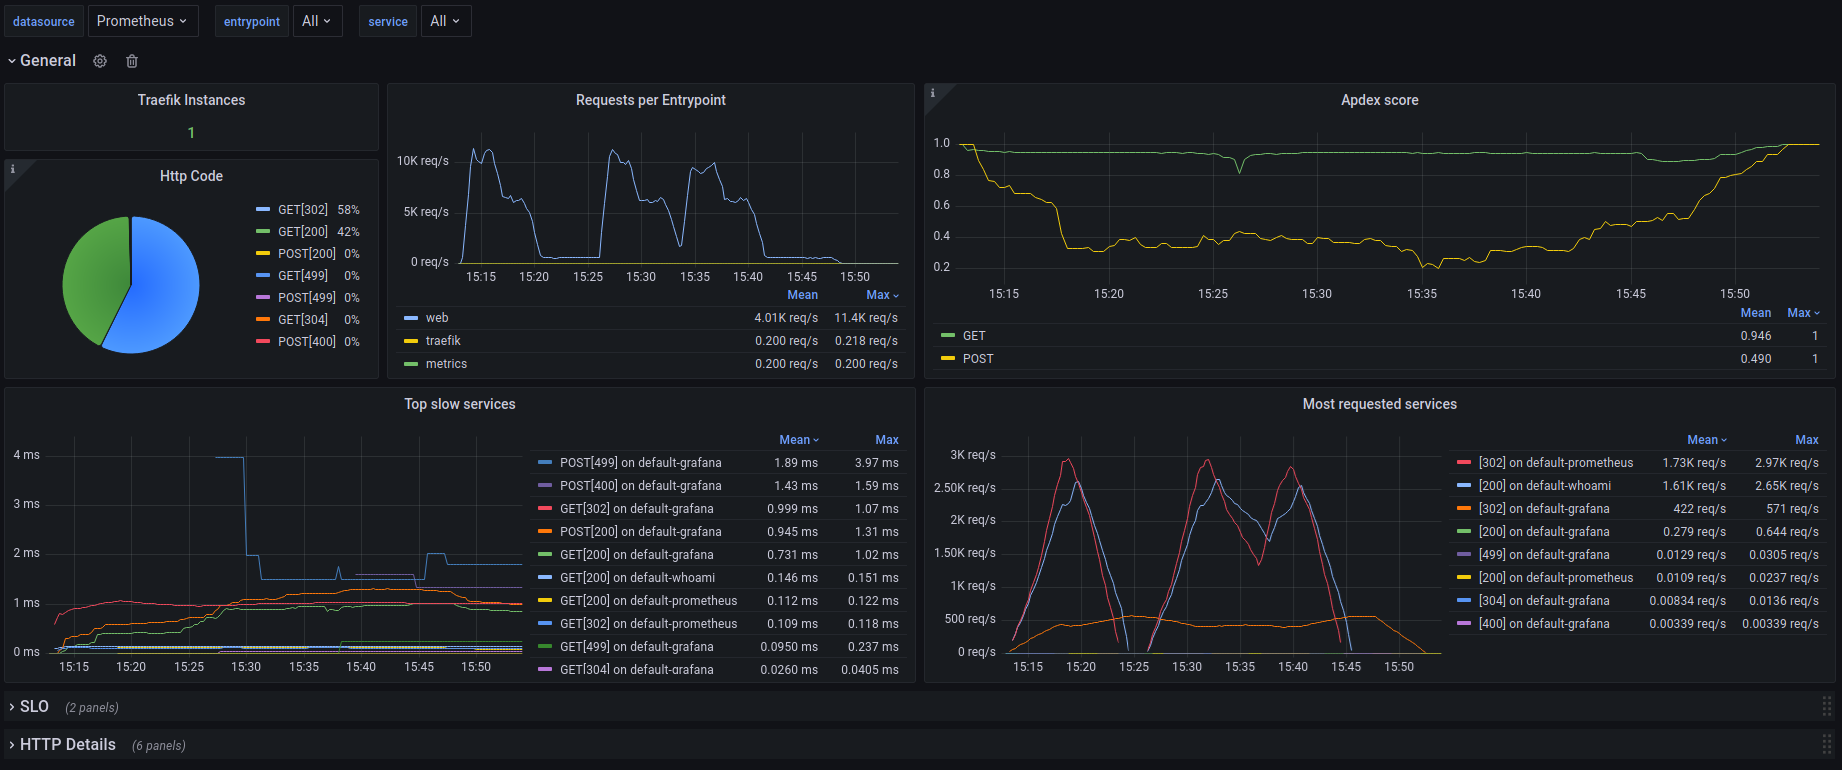
This dashboard monitors Traefik traffic and performance, focusing on request throughput, latency, and service/entrypoint health. It highlights requests per entrypoint using traefik_entrypoint_requests_total and latency breakdowns with traefik_entrypoint_request_duration_seconds_bucket/..._count, while also surfacing top services and slow endpoints via traefik_service_requests_total, traefik_service_request_duration_seconds_sum/_count and service metadata. Other features include reloads visibility through traefik_config_reloads_total and an Apdex-style score for user experience assessment.
Screenshots
Used Metrics 1010
interval
service
topk
traefik_config_reloads_total
traefik_entrypoint_request_duration_seconds_bucket
traefik_entrypoint_request_duration_seconds_count
traefik_entrypoint_requests_total
traefik_service_request_duration_seconds_count
traefik_service_request_duration_seconds_sum
traefik_service_requests_total