Traefik Official Kubernetes Dashboard 5,081,6205,081,620
Description
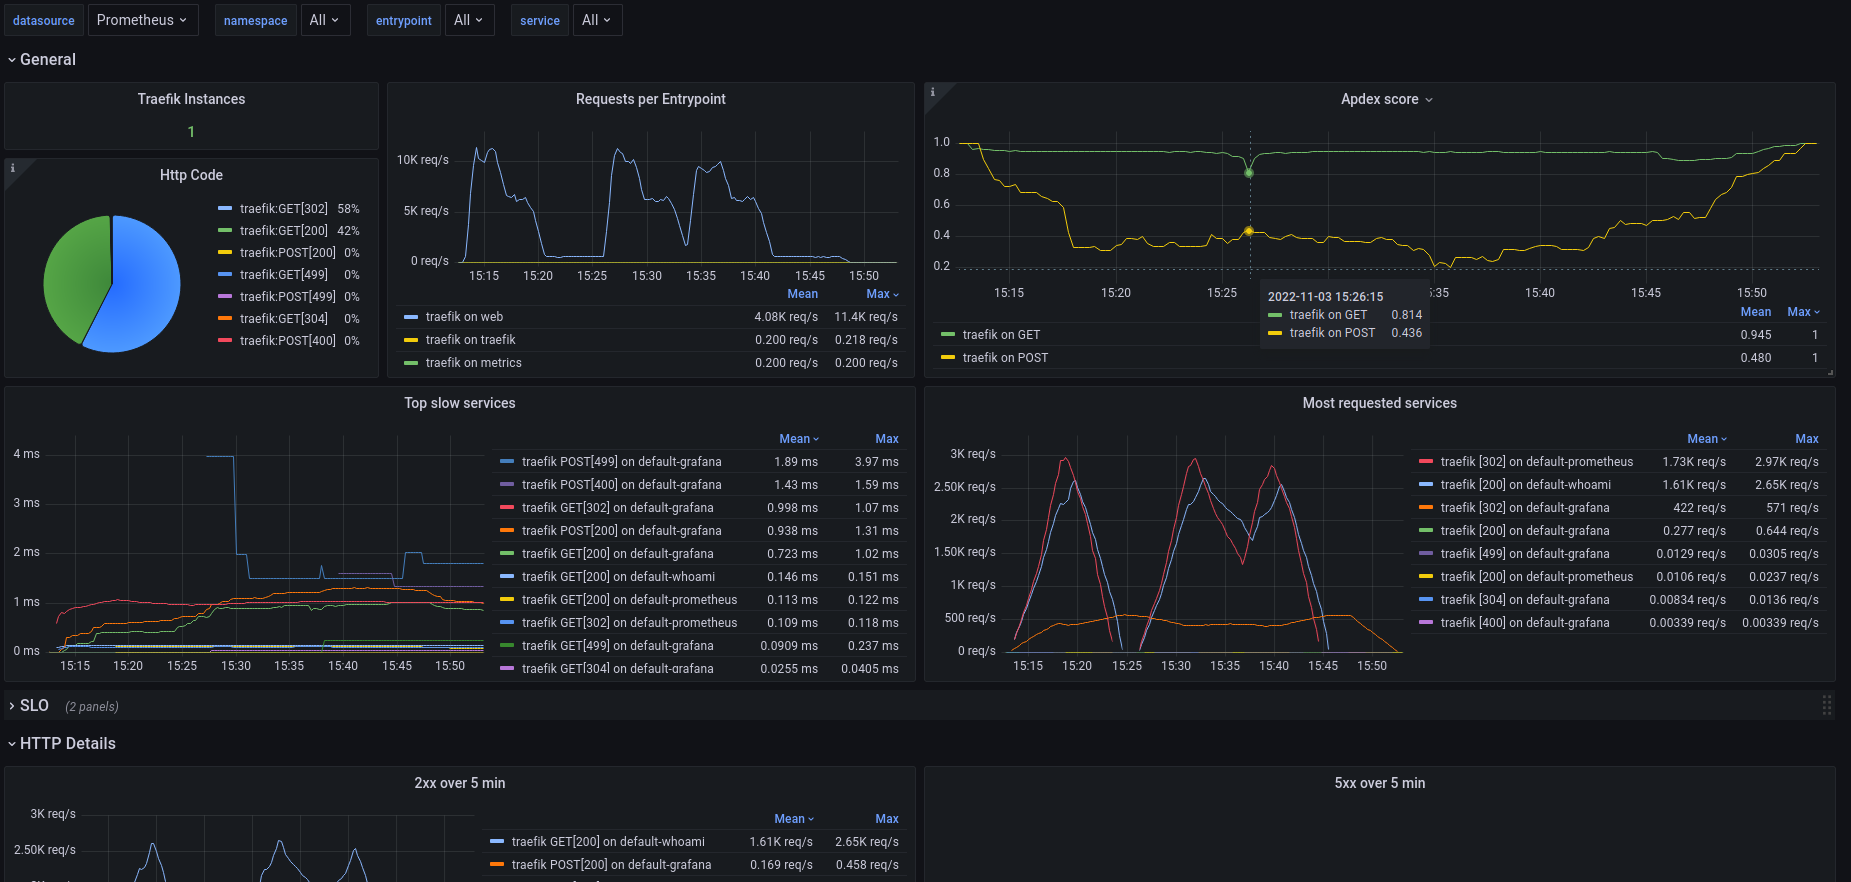
This dashboard monitors the health and performance of Traefik running on Kubernetes, including reload activity, entrypoint load, and service-level latency. It emphasizes latency distribution with traefik_entrypoint_request_duration_seconds_bucket and traefik_entrypoint_request_duration_seconds_count, tracks requests per entrypoint and service request totals, and surfaces top slow or most-requested services via panels like Top slow services and Most requested services. It also provides status code insights with panels like 2xx over $interval, 5xx over $interval, and Other codes over $interval, plus payload sizes through Requests Size and Responses Size panels for a comprehensive view of traffic characteristics.
Screenshots
Used Metrics 1313
interval
service
topk
traefik_config_reloads_total
traefik_entrypoint_request_duration_seconds_bucket
traefik_entrypoint_request_duration_seconds_count
traefik_entrypoint_requests_total
traefik_open_connections
traefik_service_request_duration_seconds_count
traefik_service_request_duration_seconds_sum
traefik_service_requests_bytes_total
traefik_service_requests_total
traefik_service_responses_bytes_total