Traefik Backend 1,0751,075
12/5/2018
12/5/2018
4
DockerWeb Servers
>=5.2.4
Prometheus
Description
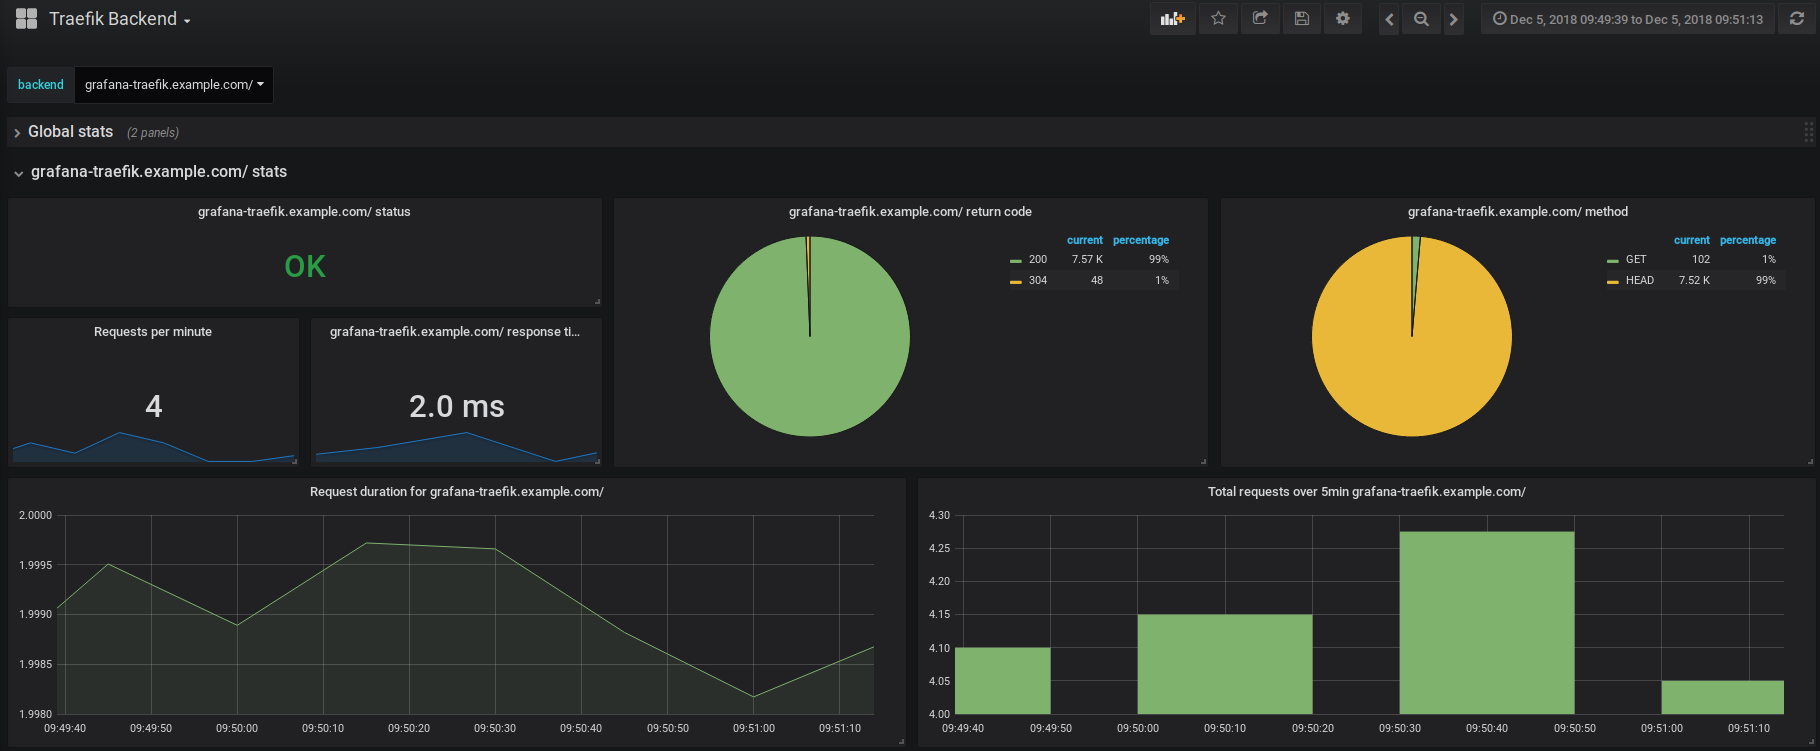
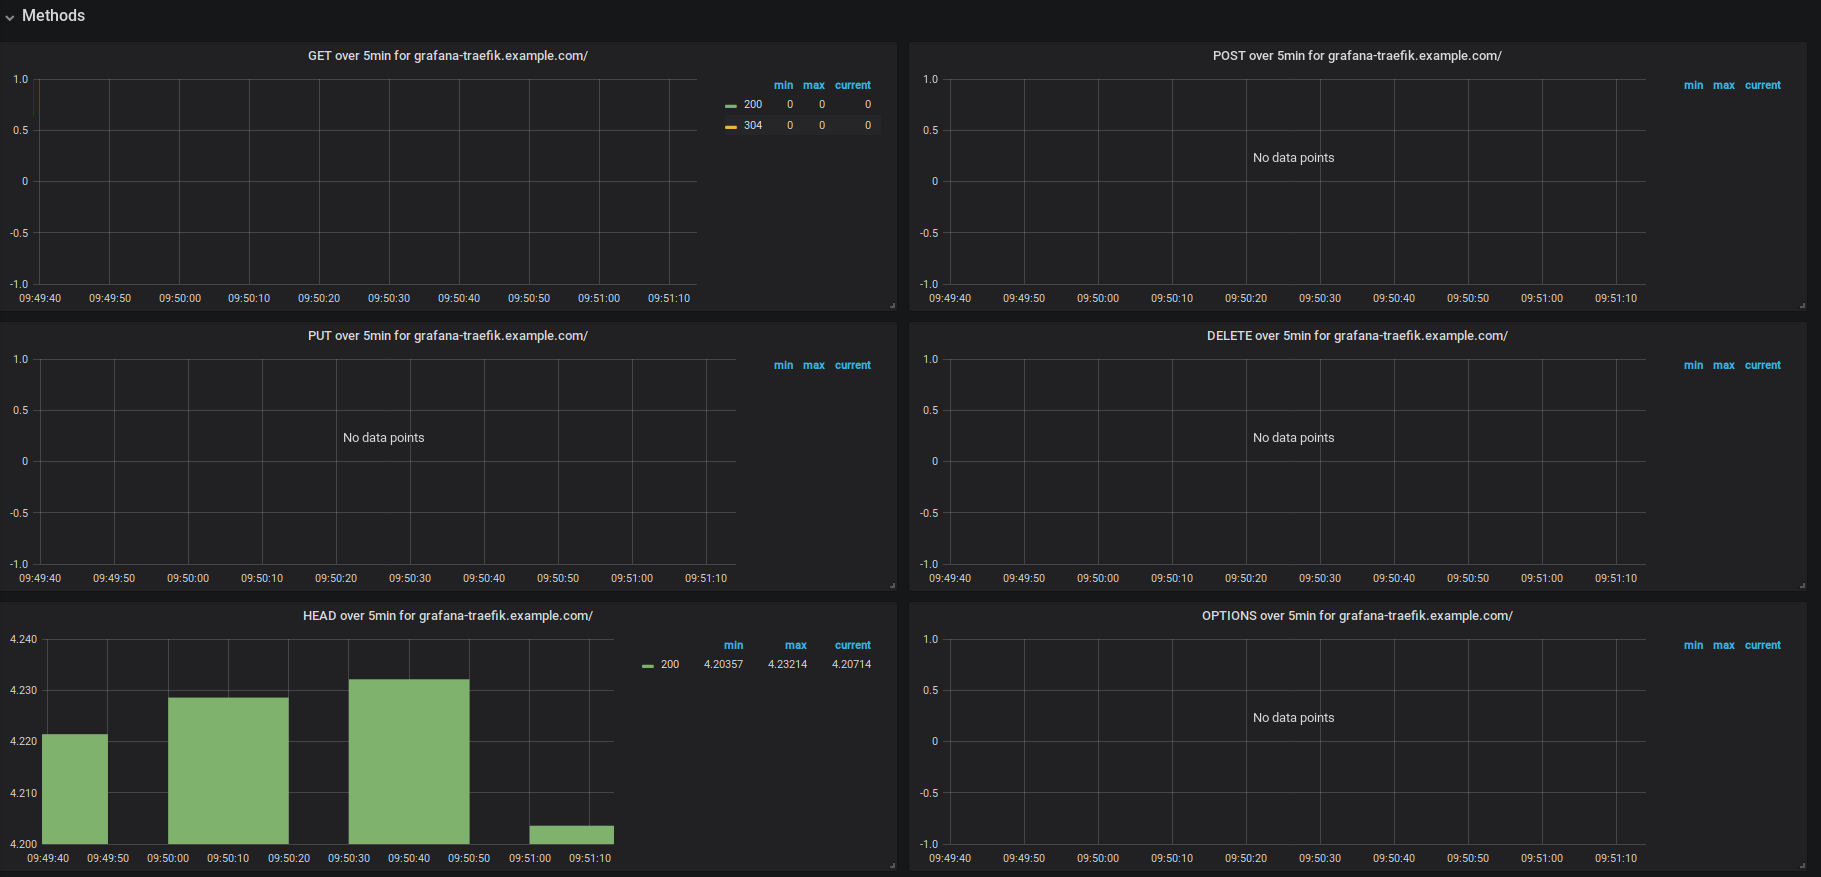
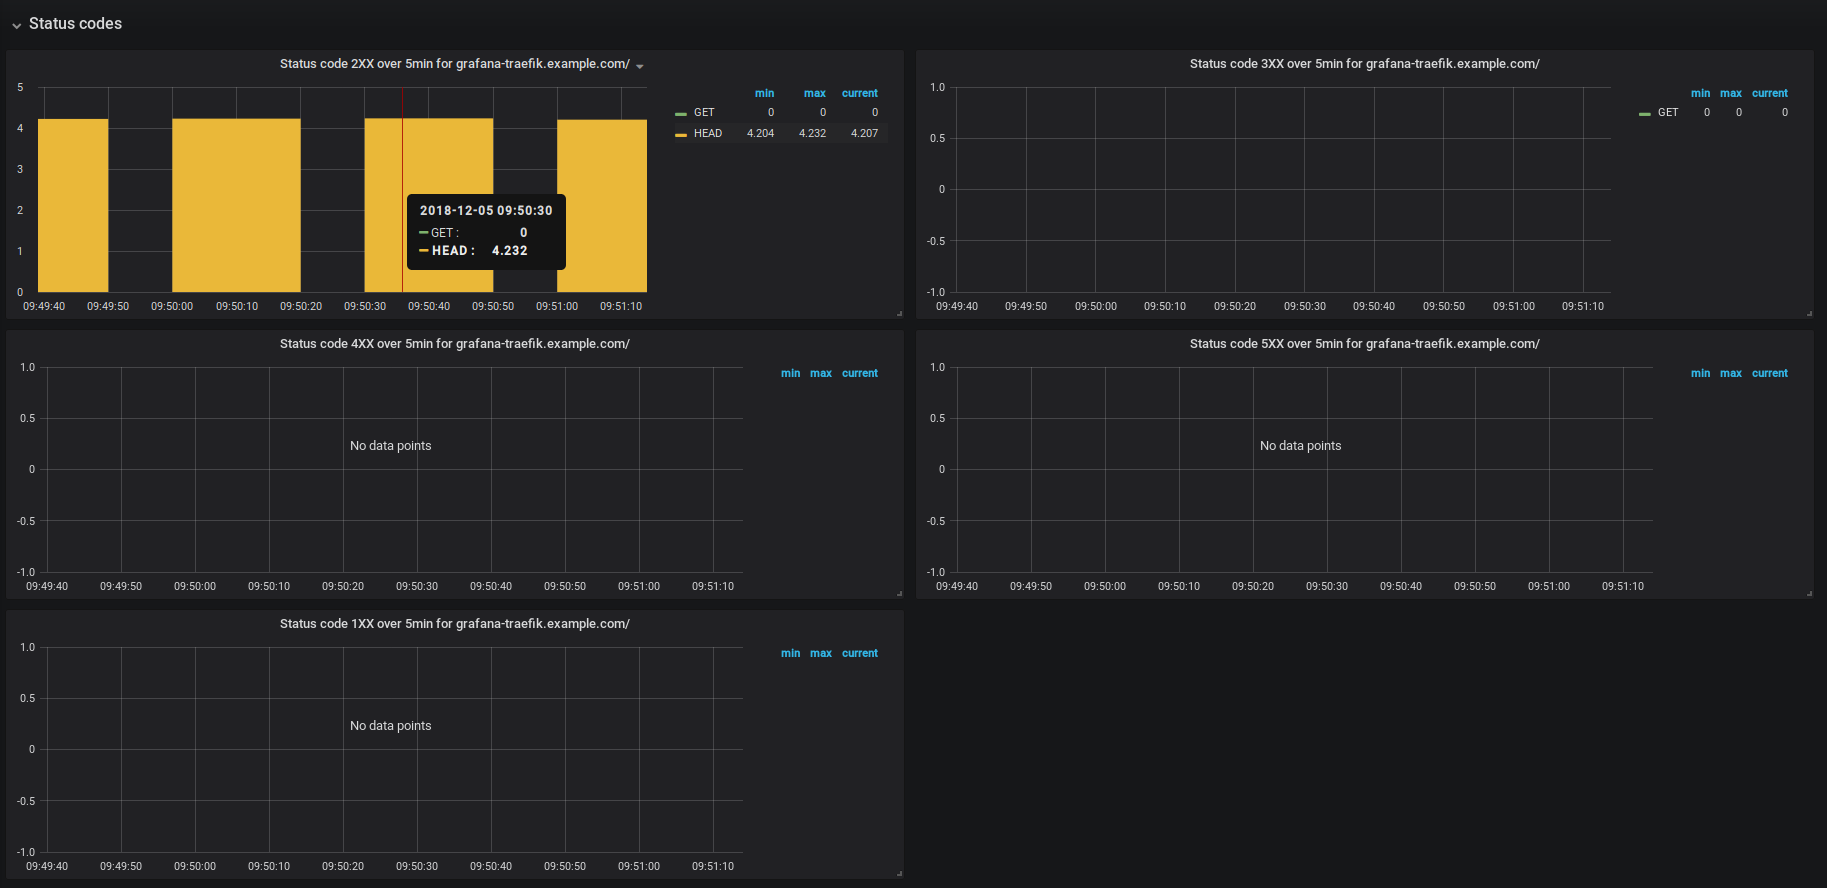
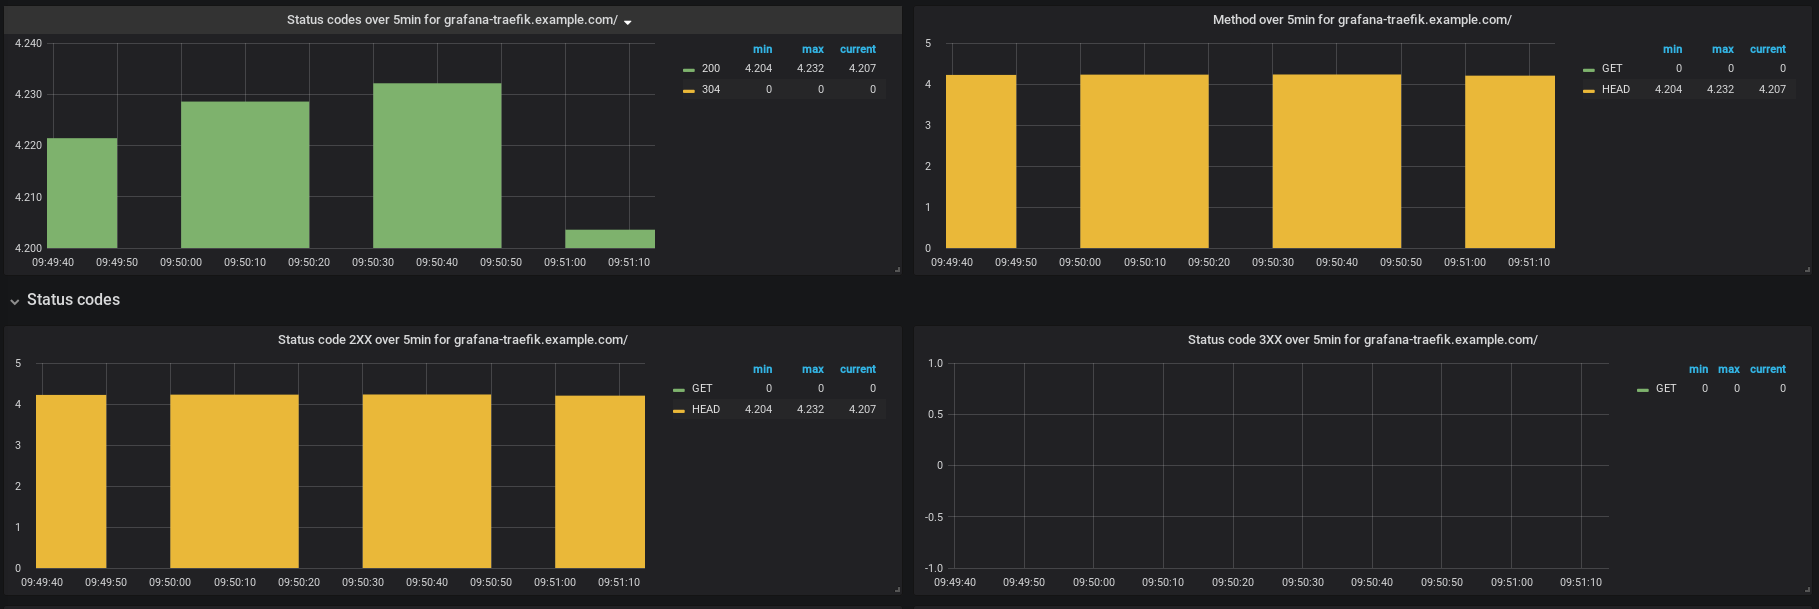
Traefik dashboard prometheus
Screenshots
Used Metrics 44
traefik_backend_request_duration_seconds_sum
traefik_backend_requests_total
traefik_backend_server_up
traefik_config_reloads_total
Get Dashboard✕
Download
Copy to Clipboard