Traefik 2.2 1,1061,106
6/29/2020
6/29/2020
1
>=7.0.3
Prometheus
Description
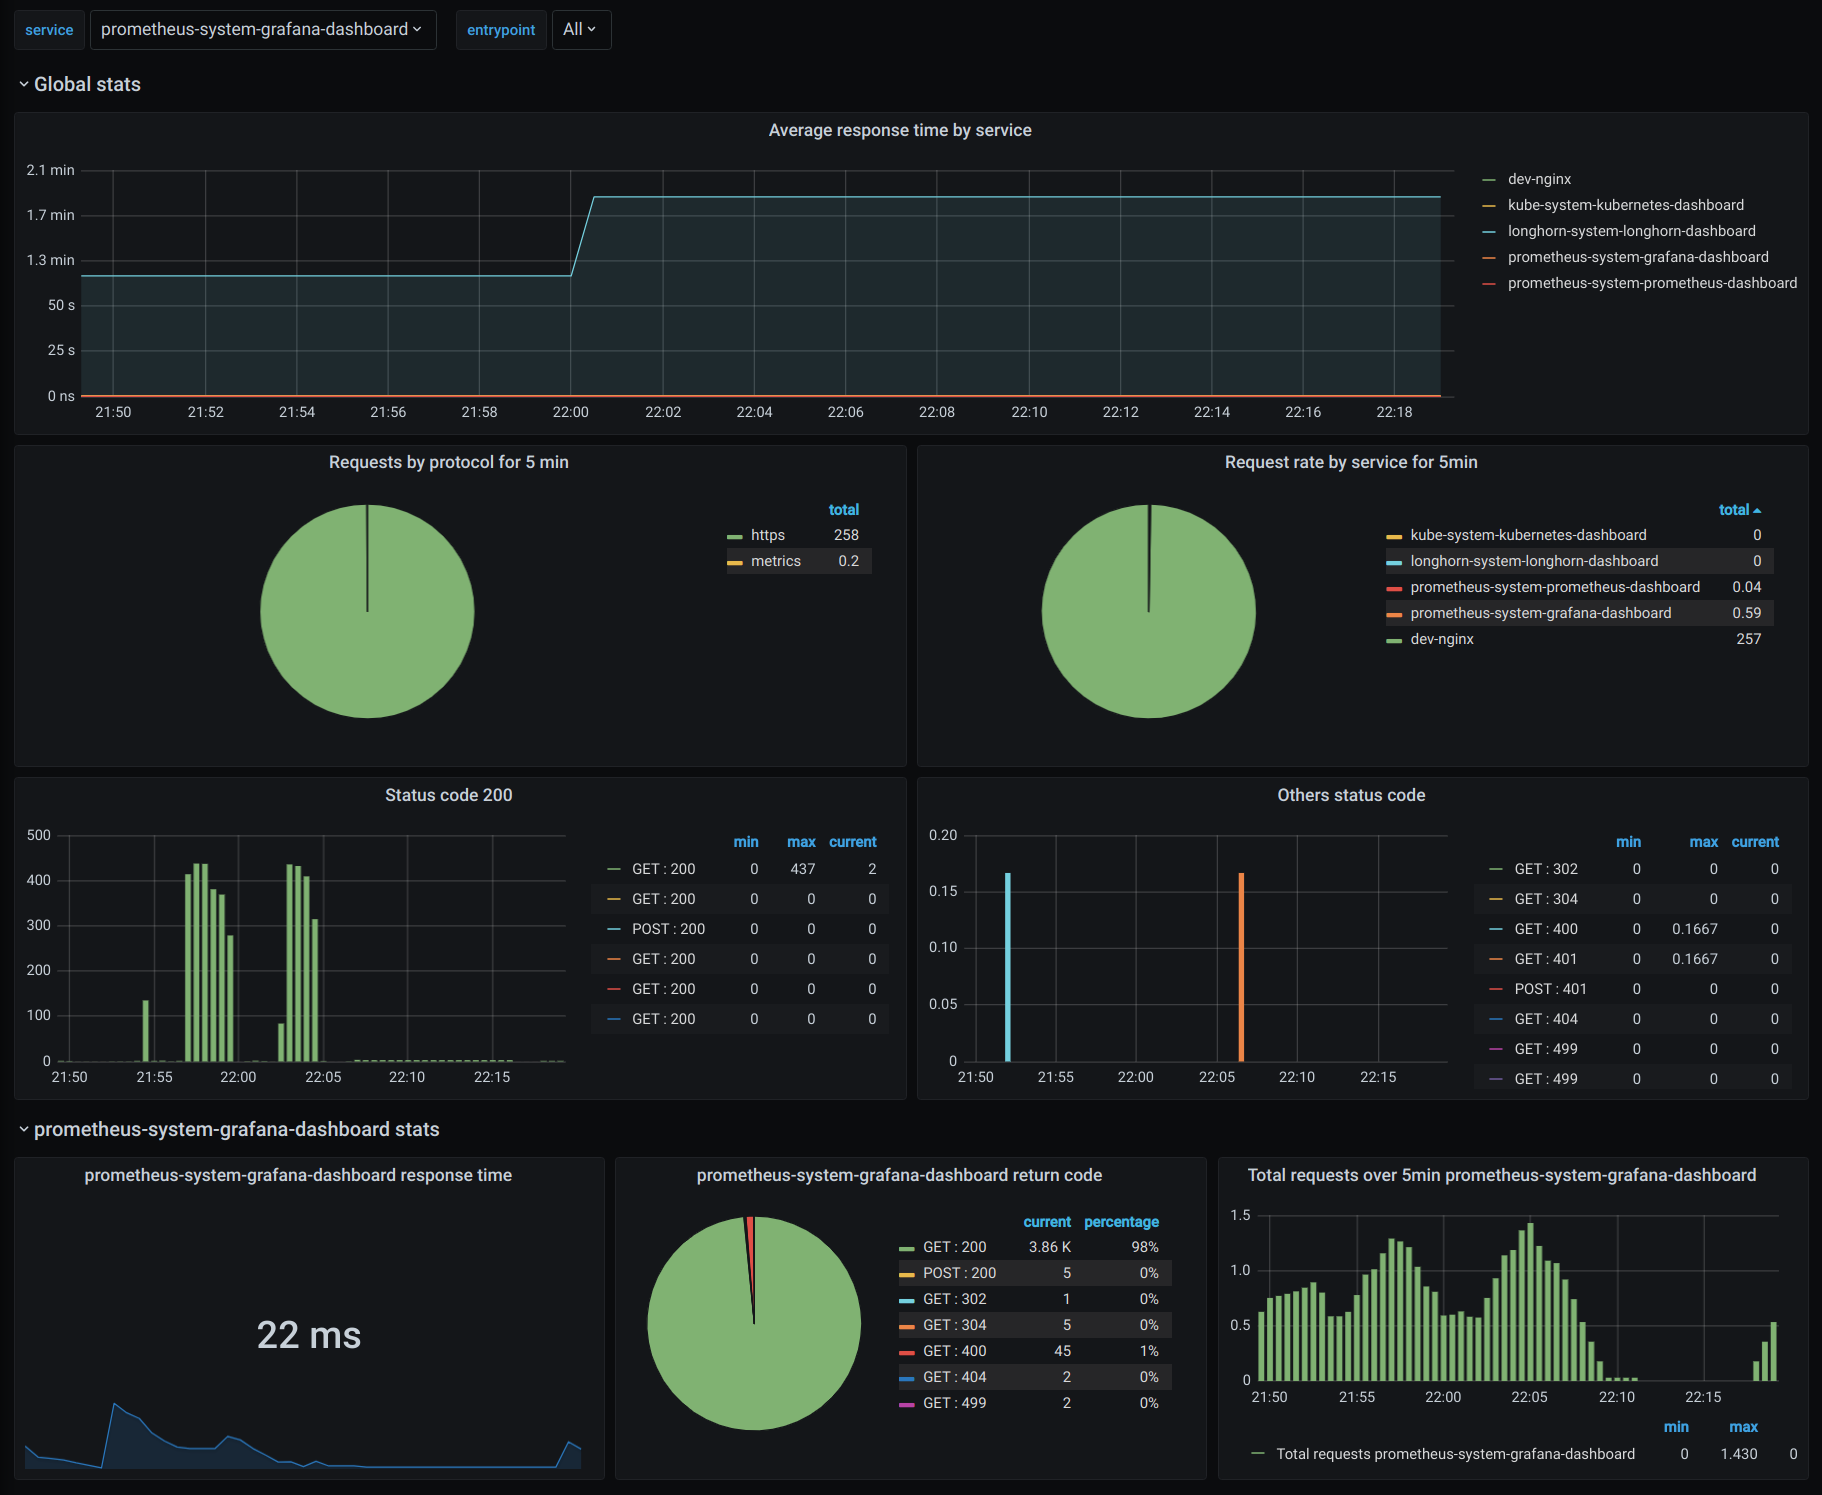
Traefik dashboard (data from prometheus on k8s) (based on Traefik by Thomas Cheronneau https://grafana.com/grafana/dashboards/4475)
Screenshots
Used Metrics 66
exported_service
short_label
traefik_entrypoint_requests_total
traefik_service_request_duration_seconds_count
traefik_service_request_duration_seconds_sum
traefik_service_requests_total
Get Dashboard✕
Download
Copy to Clipboard