Traefik 2.2 512,365512,365
Description
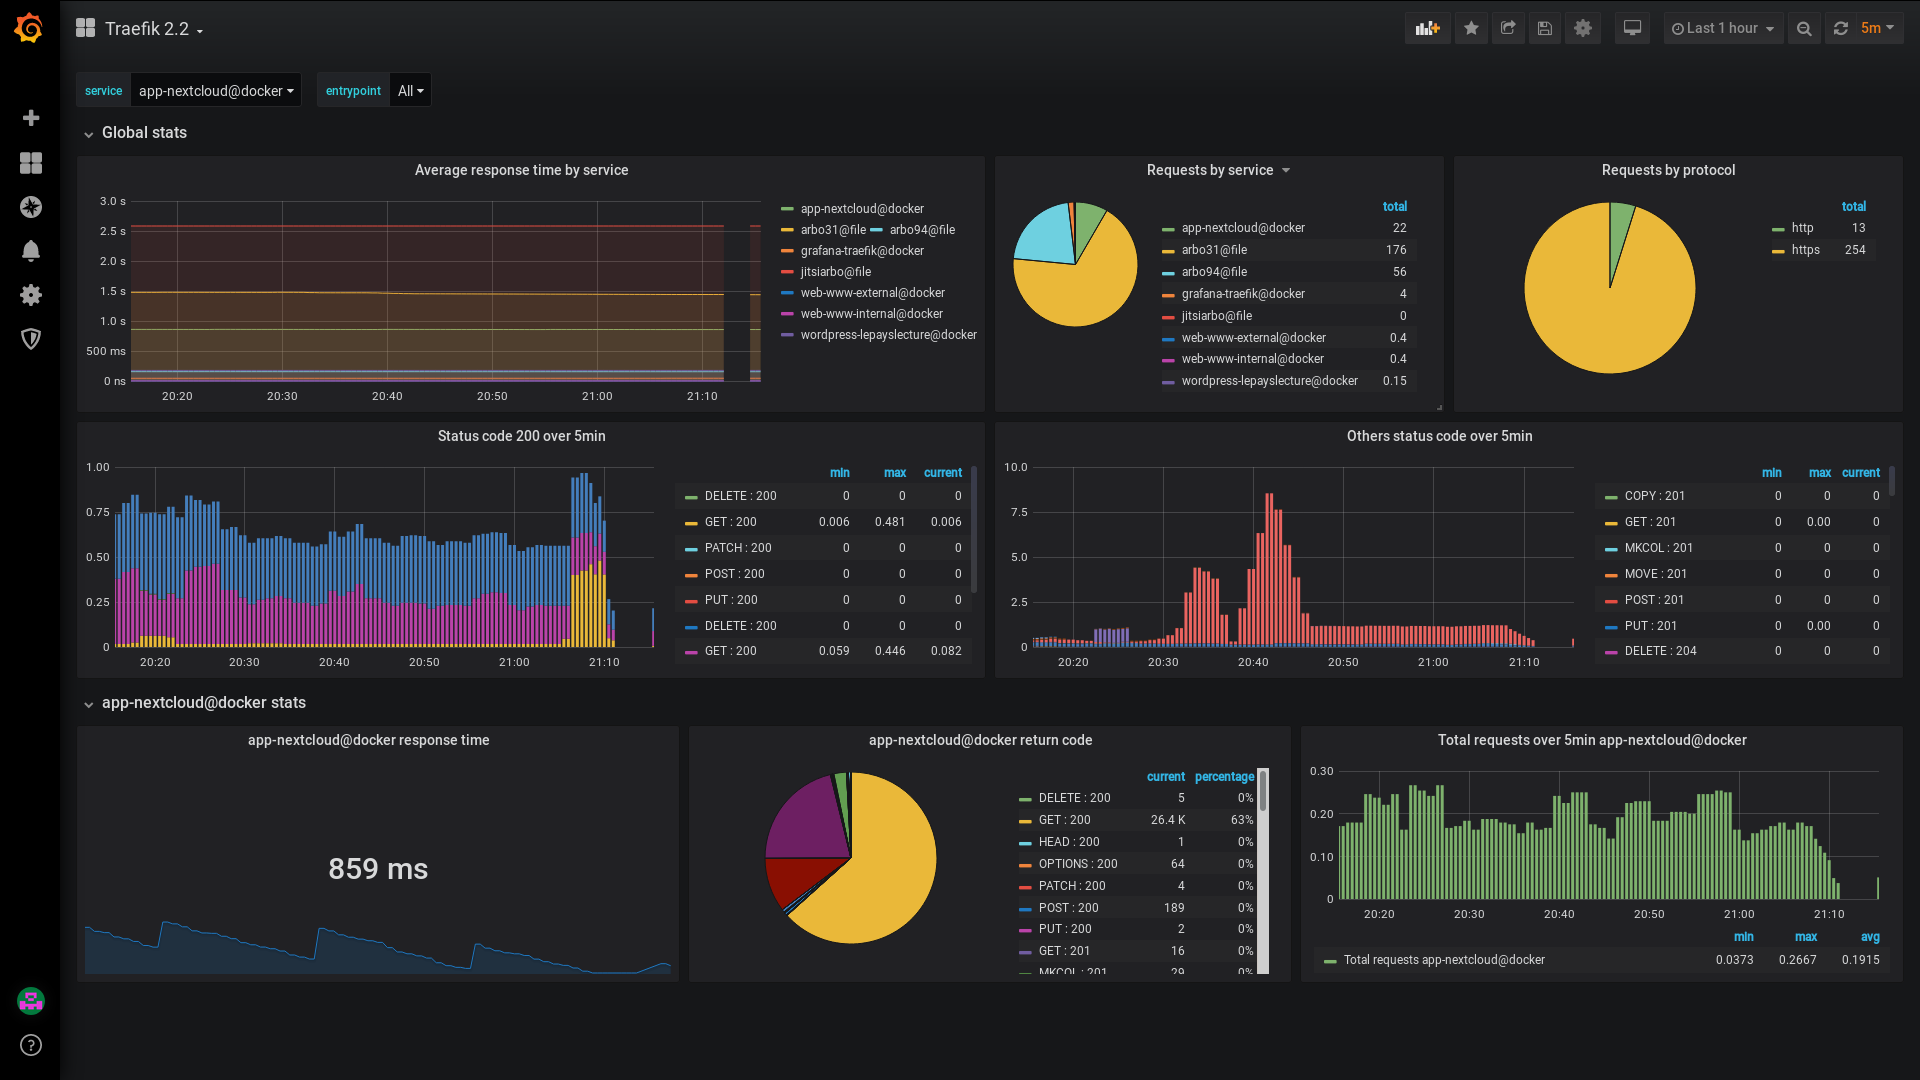
This dashboard monitors Traefik traffic and performance, aggregating requests by service and protocol to reveal latency, volume, and error patterns. It highlights key metrics such as traefik_service_request_duration_seconds_sum and traefik_service_request_duration_seconds_count to compute average response times, as well as traefik_service_requests_total and traefik_entrypoint_requests_total to track request throughput by service and entrypoint. Visualizations include time-bucketed latency, request counts over 5 minutes, and status code distributions (e.g., 200s), enabling quick detection of slow services and abnormal traffic.
Screenshots
Used Metrics 44
traefik_entrypoint_requests_total
traefik_service_request_duration_seconds_count
traefik_service_request_duration_seconds_sum
traefik_service_requests_total