Tomcat dashboard 22,07822,078 3.0 (1 reviews)
10/30/2018
12/20/2018
10
Host MetricsWeb Servers
>=5.4.2
Description
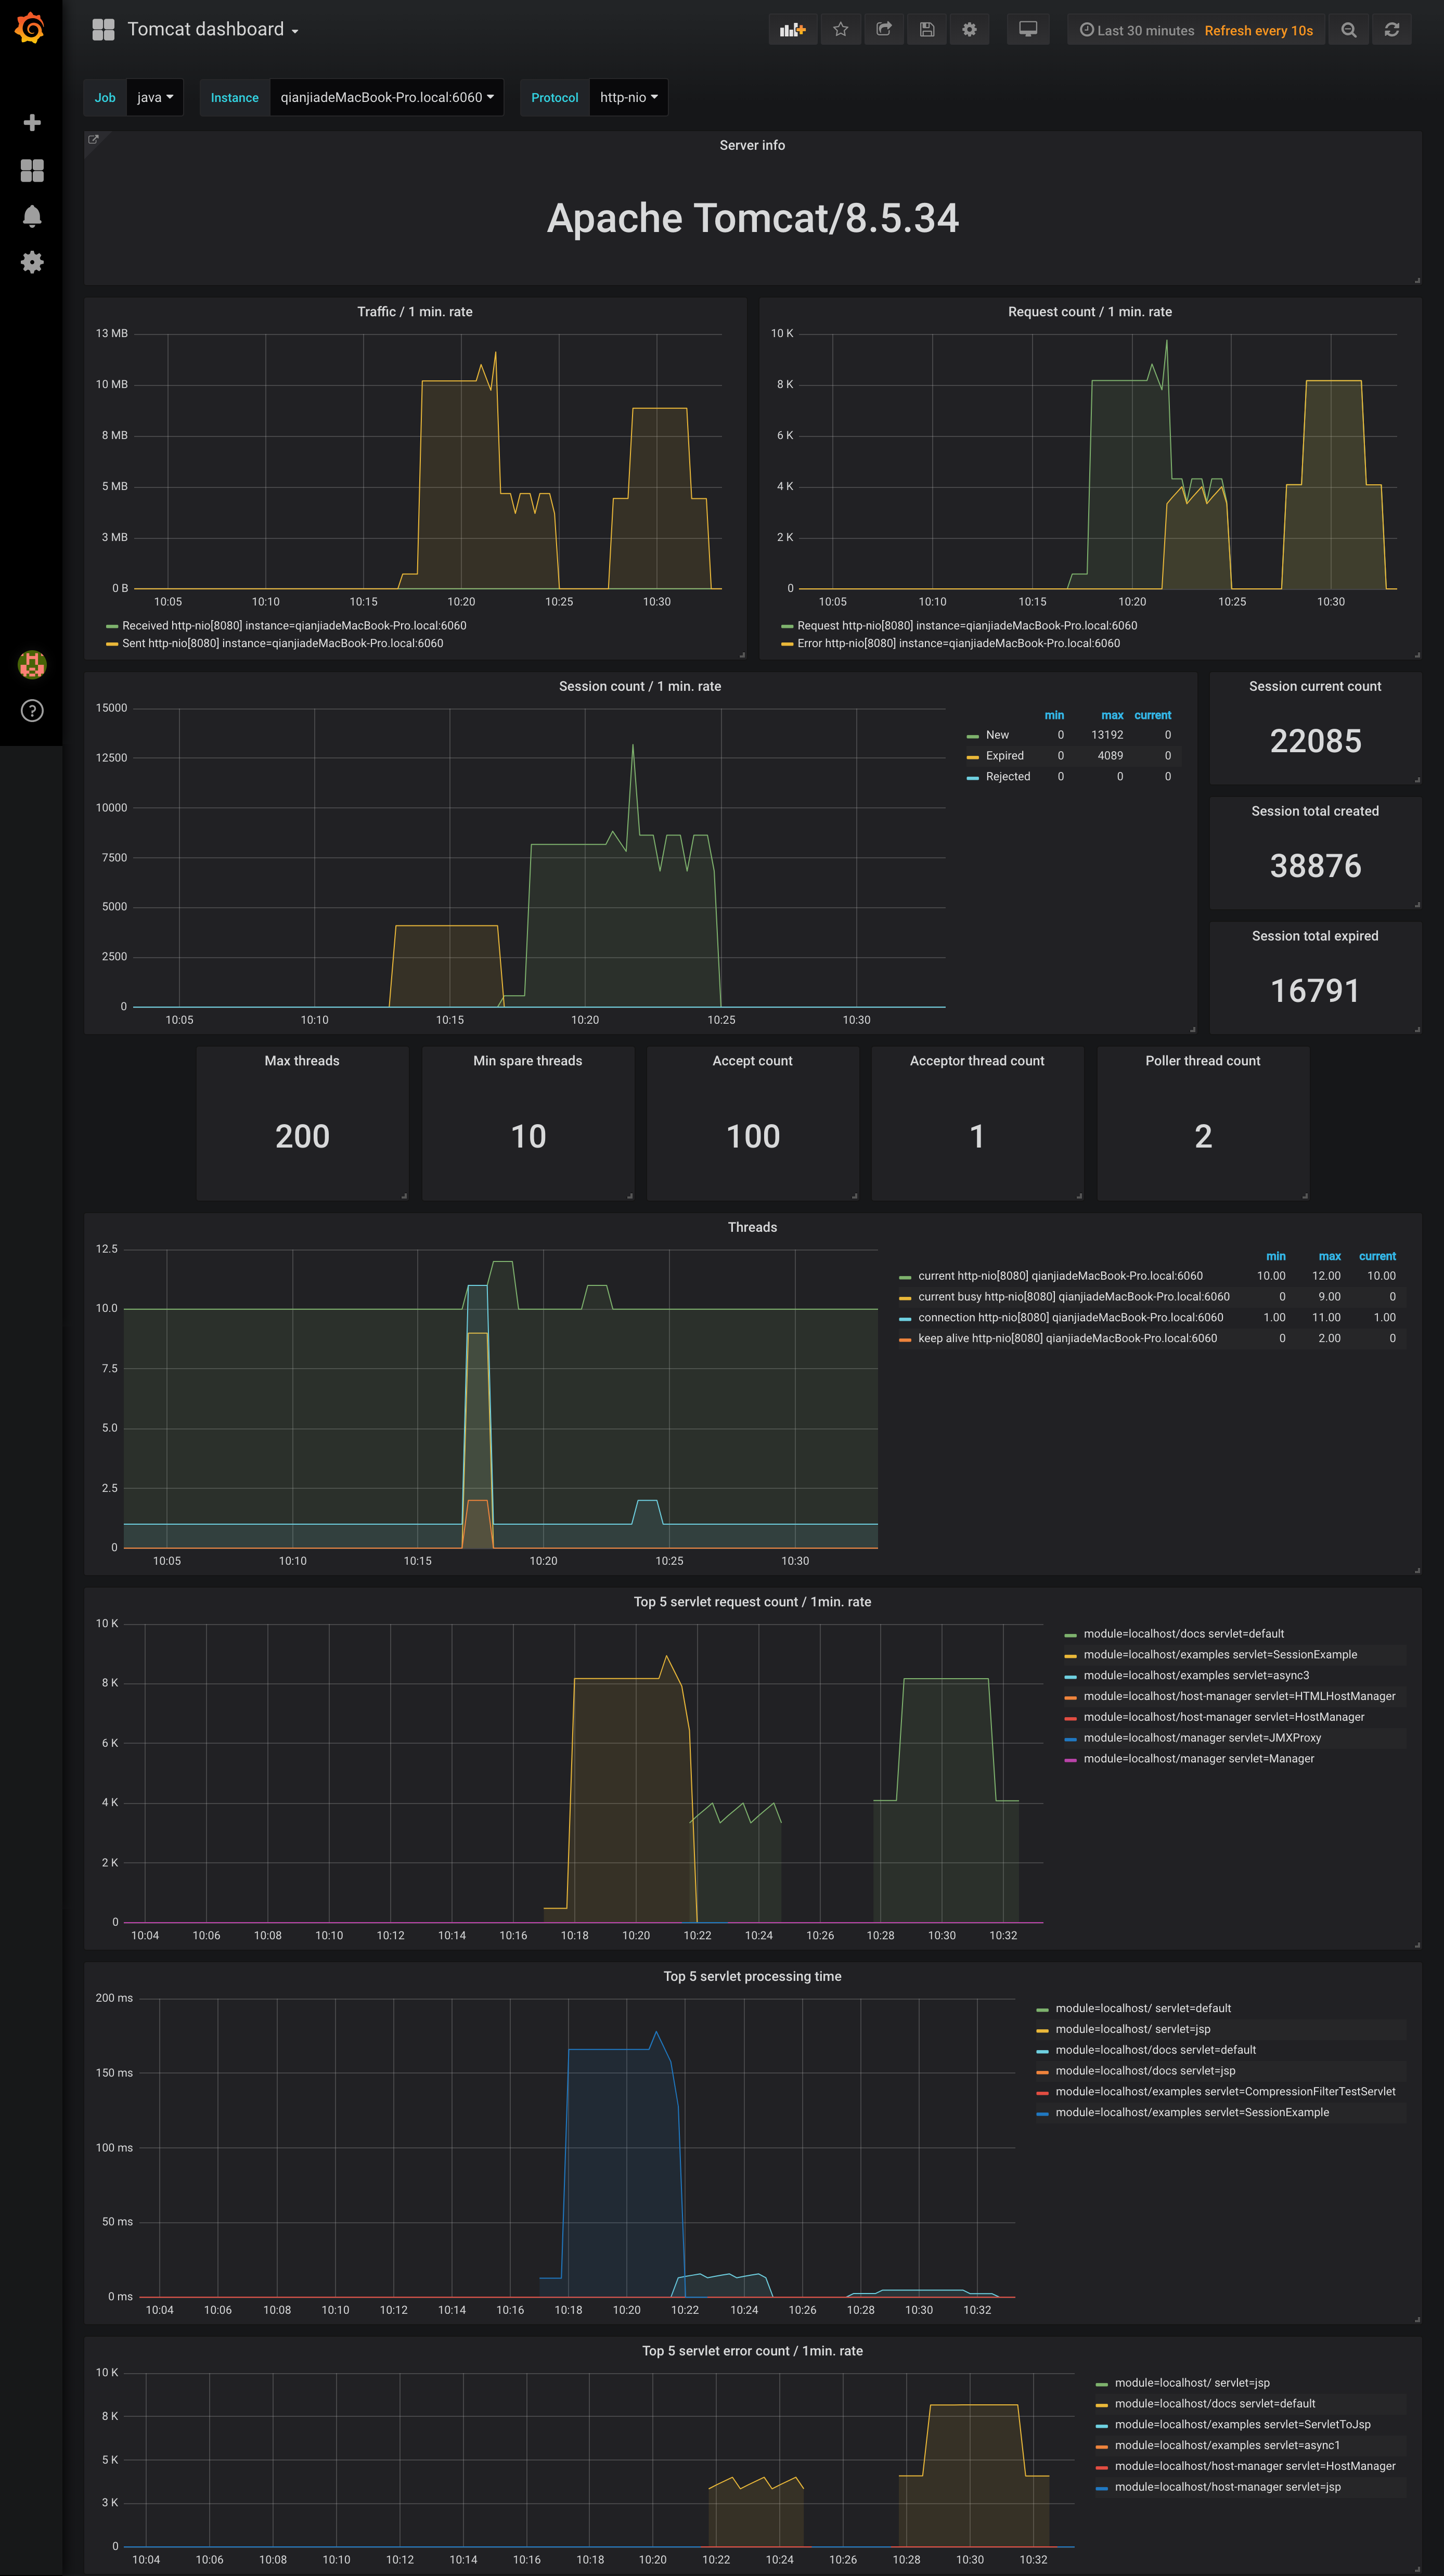
Tomcat dashboard using metrics from prometheus JMX exporter, with drill down per job > instance
Screenshots
Used Metrics 2121
tomcat_bytesreceived_total
tomcat_bytessent_total
tomcat_errorcount_total
tomcat_requestcount_total
tomcat_serverinfo
tomcat_servlet_errorcount_total
tomcat_servlet_processingtime_total
tomcat_servlet_requestcount_total
tomcat_session_expiredsessions_total
tomcat_session_rejectedsessions_total
tomcat_session_sessioncounter_total
tomcat_threadpool_acceptcount
tomcat_threadpool_acceptorthreadcount
tomcat_threadpool_connectioncount
tomcat_threadpool_currentthreadcount
tomcat_threadpool_currentthreadsbusy
tomcat_threadpool_keepalivecount
tomcat_threadpool_maxthreads
tomcat_threadpool_minsparethreads
tomcat_threadpool_pollerthreadcount
topk
Get Dashboard✕
Download
Copy to Clipboard