Tomcat 1,4211,421
5/15/2018
7/5/2018
2
>=5.1.3
Prometheus
Description
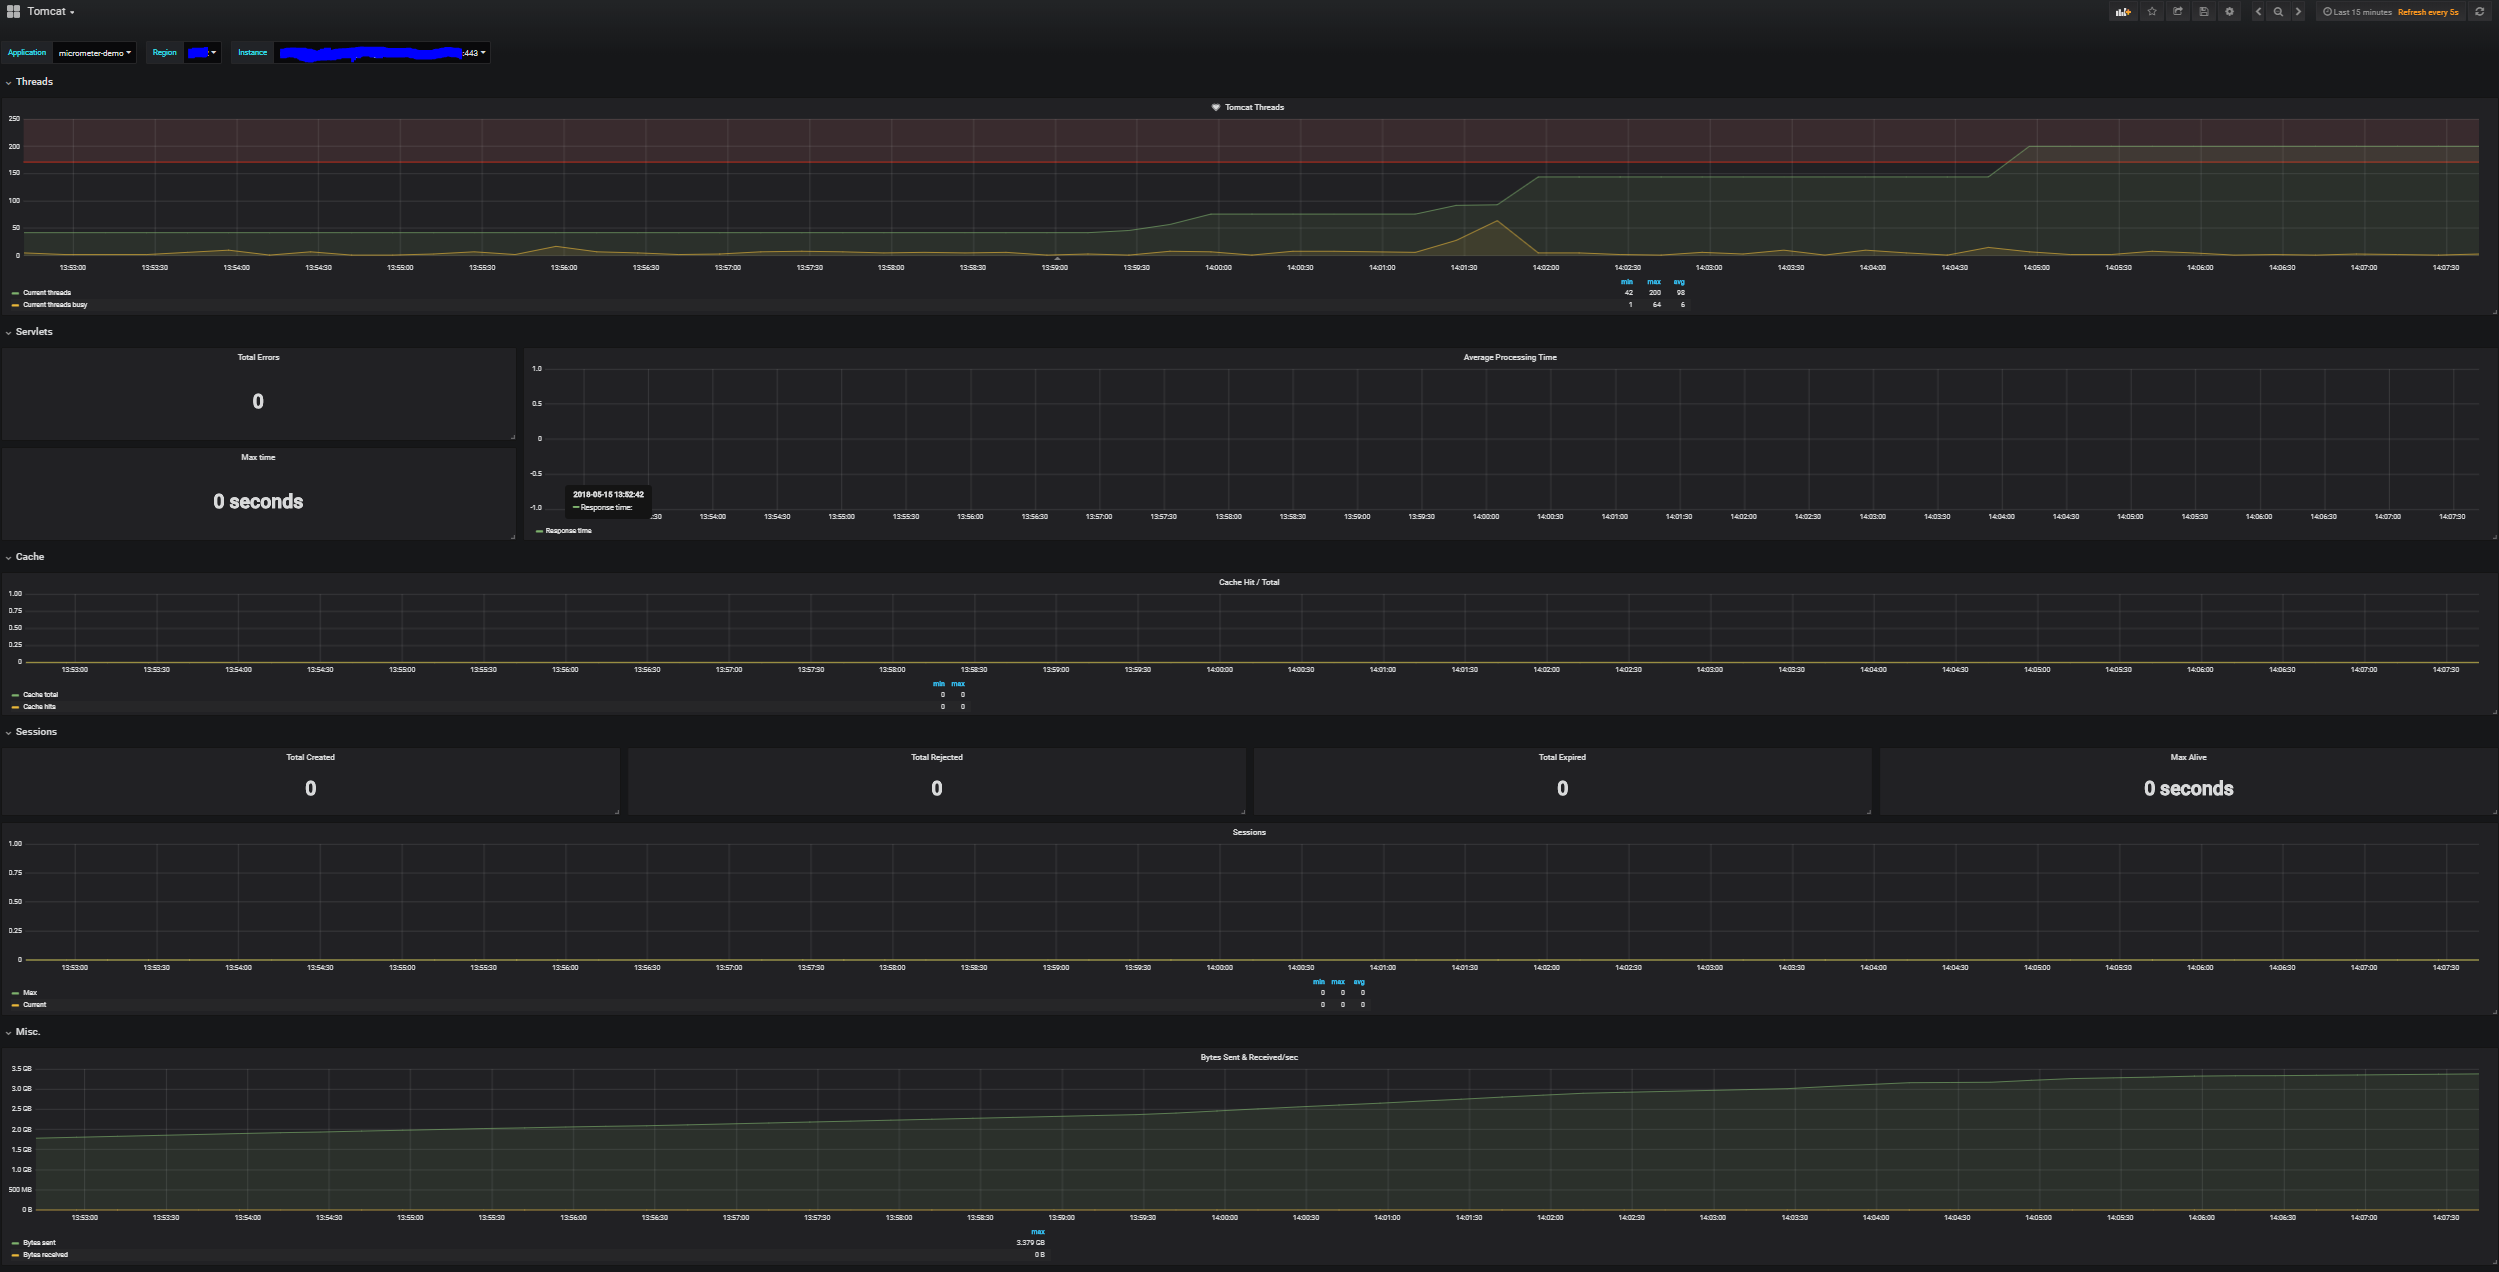
Tomcat Dashboard (Micrometer.io)
Screenshots
Used Metrics 1616
tomcat_cache_access_total
tomcat_cache_hit_total
tomcat_global_received_bytes_total
tomcat_global_sent_bytes_total
tomcat_servlet_error_total
tomcat_servlet_request_max_seconds
tomcat_servlet_request_seconds_count
tomcat_servlet_request_seconds_sum
tomcat_sessions_active_current
tomcat_sessions_active_max
tomcat_sessions_alive_max_seconds
tomcat_sessions_created_total
tomcat_sessions_expired_total
tomcat_sessions_rejected_total
tomcat_threads_busy
tomcat_threads_current
Get Dashboard✕
Download
Copy to Clipboard