Terraform Enterprise 1,2051,205
1/26/2022
1/9/2023
3
>=8.3.4
Prometheus
Description
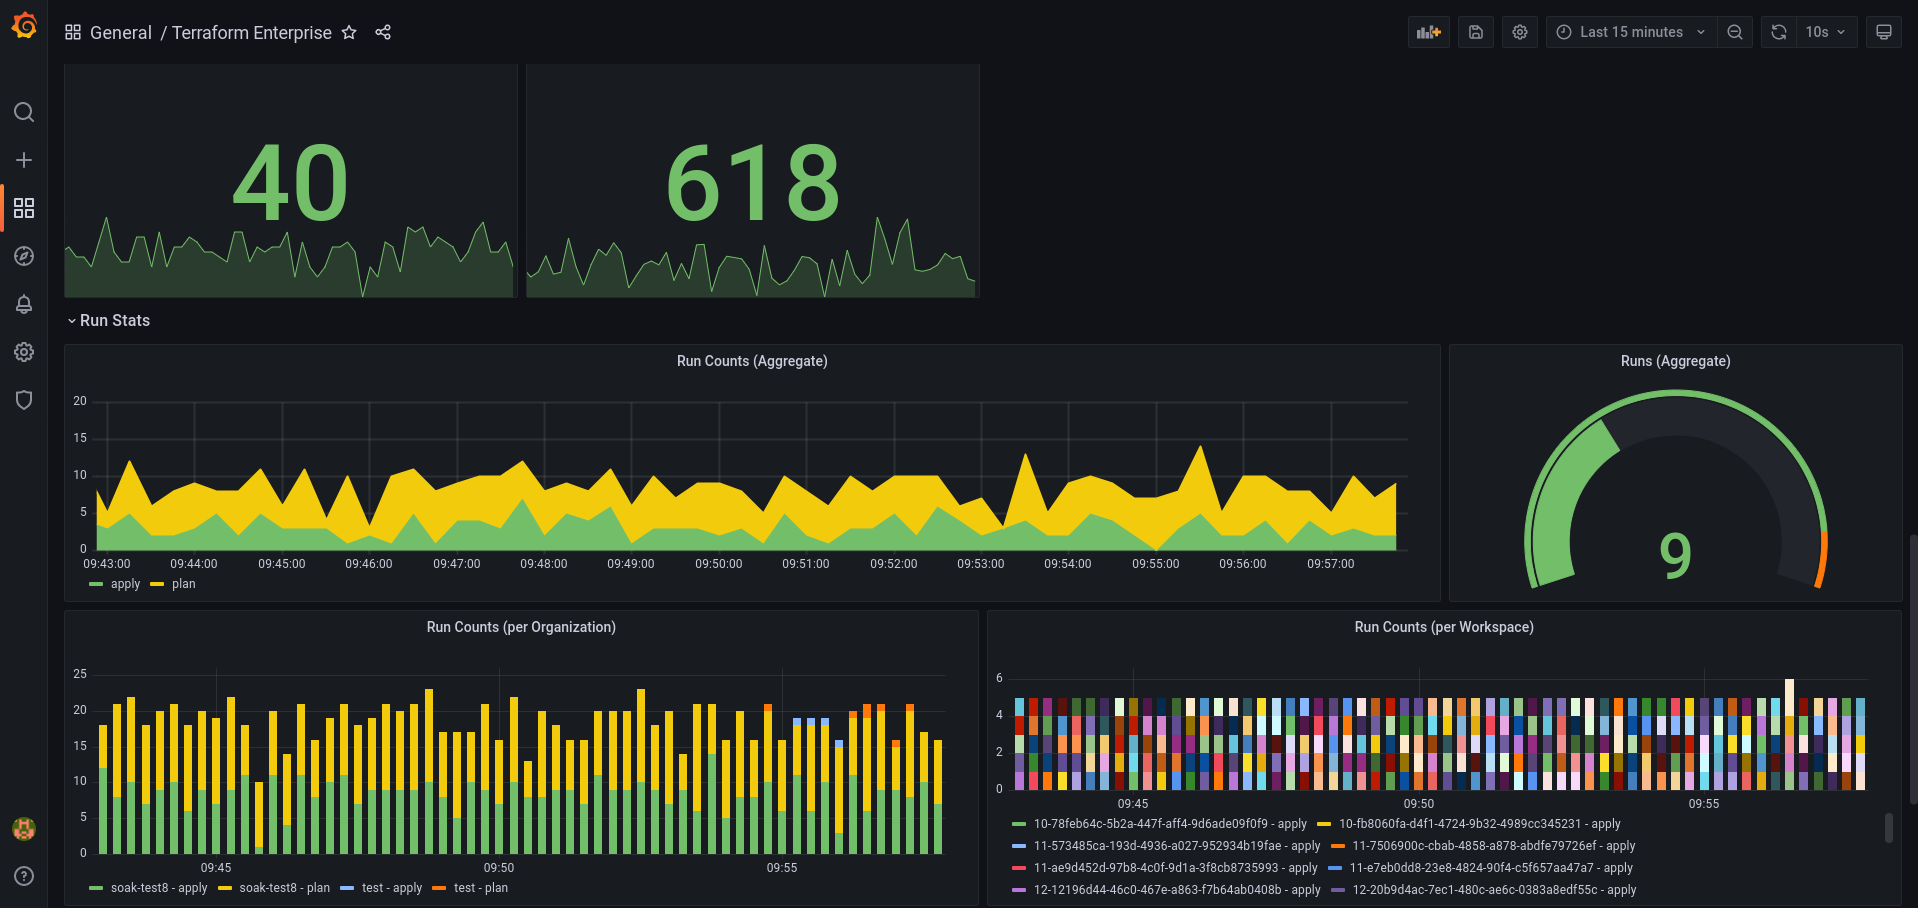
A Grafana dashboard for Terraform Enterprise
Screenshots
Used Metrics 2121
:
e7
rangeinterval
rangeinterval:
tfe_container_cpu_usage_kernel_ns
tfe_container_cpu_usage_user_ns
tfe_container_disk_io_op_read_total
tfe_container_disk_io_op_write_total
tfe_container_memory_used_bytes
tfe_container_network_rx_bytes_total
tfe_container_network_rx_packets_total
tfe_container_network_tx_bytes_total
tfe_container_network_tx_packets_total
tfe_container_process_count
tfe_metrics_collect_duration_ms
tfe_metrics_statsd_bytes_count
tfe_metrics_statsd_packet_count
tfe_run_count
tfe_run_current_count
tfe_run_limit
topk
Get Dashboard✕
Download
Copy to Clipboard